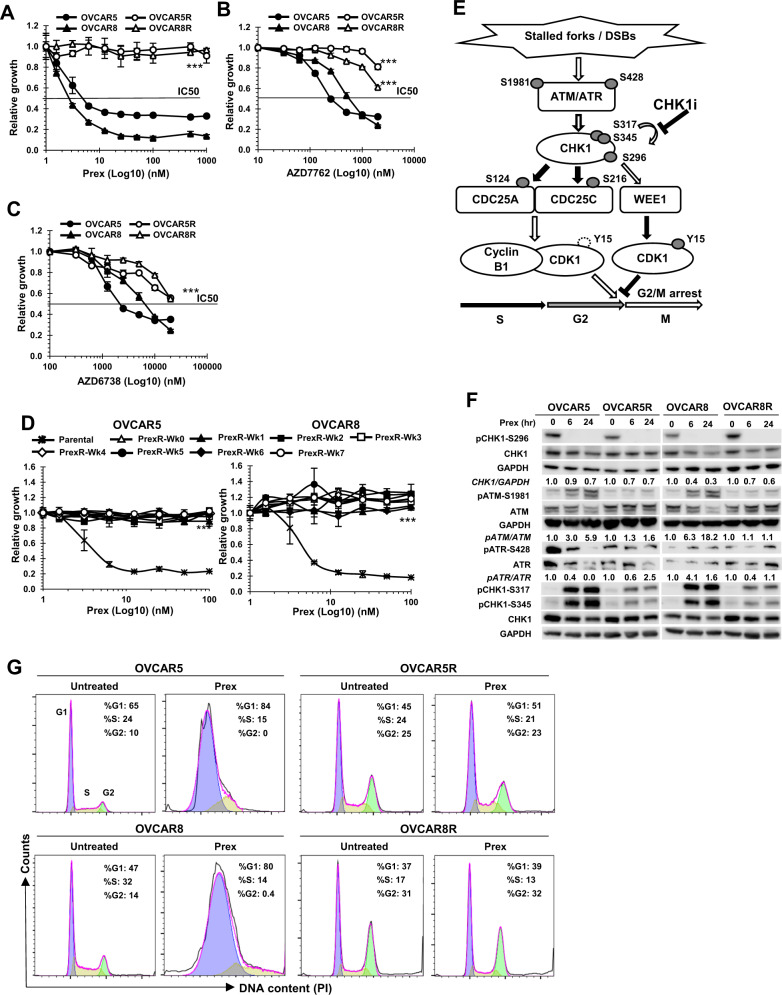
Fig. 1. Acquired resistance to CHK1 inhibition in BRCAwt HGSOC cell lines involves a persistent G2 delay.
a–c Parental cells (OVCAR5 and OVCAR8) and Prex-resistant cell lines (OVCAR5R and OVCAR8R) were treated with CHK1i Prex (0–1 µM) (a), another CHK1i AZD7762 (0–2 µM) (b), or an ATR inhibitor AZD6738 (0–20 µM) (c) for 48 h. The growth rates were determined by XTT assay. d Prex-resistant (PrexR) cell lines OVCAR5R and OVCAR8R were cultured without Prex for 7 weeks, the growth rates at indicated weeks (Wk) were measured by XTT assay. Parental cells are included as controls. e ATR and ATM phosphorylate CHK1 at S345 and S317 in response to DNA damage or replication stress, and subsequently induce its autophosphorylation at S296 for full activation. Activated CHK1 then phosphorylates its substrates CDC25A and CDC25C, which are essential for maintaining the dephosphorylated state of active CDK1. Accumulation of inactive CDK1 phosphorylated by WEE1 kinase at Y15 induces G2 arrest, allowing time for DNA repair prior to mitotic entry. CHK1i Prex abrogates this process, resulting in early mitotic entry with unrepaired DNA damage, leading to replication catastrophe and cell death. Open arrows indicate activating events, while shaded arrows indicate inhibitory ones. f Immunoblotting of pCHK1-S296, pATM-S1981, pATR-S428, pCHK1-S317, pCHK1-S345, and their respective total proteins in cells treated with Prex (20 nM) for 6 and 24 h. Densitometric values of CHK1 normalized to GAPDH and pATM or pATR normalized to ATM or ATR, relative to untreated are shown. g Cell cycle analysis on parental and PrexR cells treated with or without Prex (20 nM) for 24 h. The color-coded G1, S and G2 peaks are indicated in the first panel. All experiments were repeated at least thrice. Data are shown as mean ± SD. ***P < 0.001.

