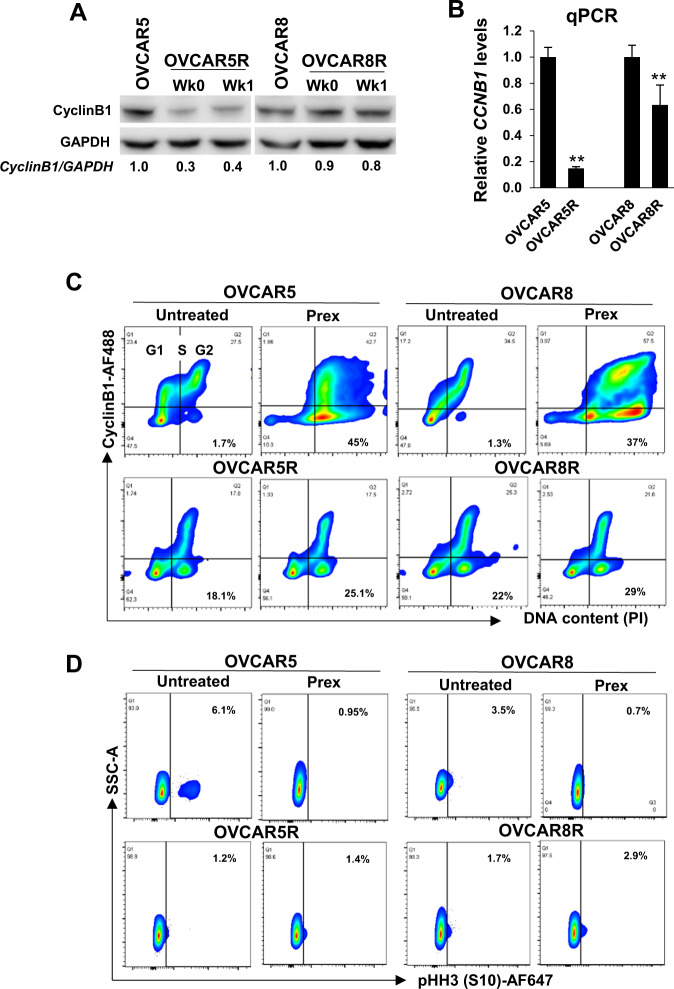
Fig. 2. CHK1i-resistant cells show reduced CyclinB1 expression.
a Western blot analysis of CyclinB1 in cells routinely cultured with CHK1i, Prex (1 µM) (Wk0) or following Prex withdrawal for a week (Wk1). Densitometric values of CyclinB1 relative to GAPDH are shown. b qPCR of CCNB1 performed on total RNA extracted from parental or PrexR cells (cultured for 4 days without Prex). c Flow cytometric analysis of cells stained for CyclinB1 on the log Y-axis against DNA content (PI) on the linear X-axis. The G1, S, and G2 cell cycle phases are marked in the first plot, while the percentage of CyclinB1-negative cells are shown in bold on the right bottom panels. d Cell populations in (c) were gated on G2 and cells that stained for mitotic marker pHH3-S10 were visualized on the log X-axis against the side scatter channel (SSC) on the linear Y-axis. Numbers in bold indicate pHH3-S10 positive G2 population. All experiments were performed at least thrice. Data are shown as mean ± SD. **P < 0.01; ***P < 0.001.

