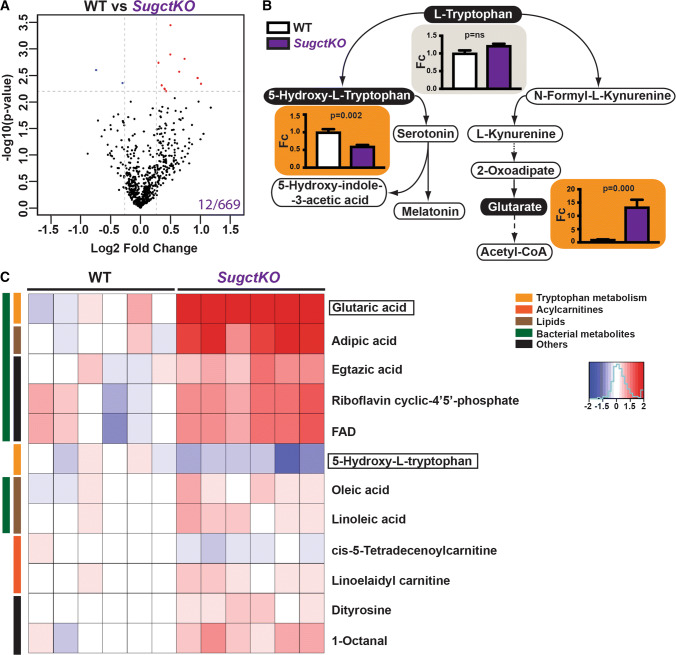
Fig. 2.
Mass-spectrometry-based metabolite profiling in SugctKO mouse kidney. Untargeted LC–MS was performed from WT and SugctKO mouse kidney using six biological and three technical replicates. a Volcano plot of 669 metabolites detected in SugctKO vs WT mouse kidney. The volcano plot was generated as a log scaled axes of fold change (Log2, x-axis) and p value (− log10, y-axis). Significantly altered metabolites (q value = 0.15, Fc ≥ 1.2) are indicated by dashed grey lines and colored in red and blue representing up- and downregulated metabolites, respectively. Note that glutarate was excluded from the Volcano plot since the scale would be vastly different. b l-tryptophan, 5-hydroxy-l-tryptophan, and glutarate levels in tryptophan catabolism from WT vs SugctKO mouse kidney. Orange and grey boxes indicate statistically significant (q value = 0.15, Fc ≥ 1.2) and nonsignificant metabolite levels, respectively. Statistical analysis was done using two-tailed parametric paired t test. c Heatmap depicting up- (red) and downregulated (blue) compounds (q value = 0.15, Fc ≥ 1.2) from WT vs SugctKO mouse kidney. Metabolites are clustered according to the following classes: tryptophan metabolism (yellow), acylcarnitines (orange), lipids (brown), metabolites of bacterial origin (green), and others (black)

