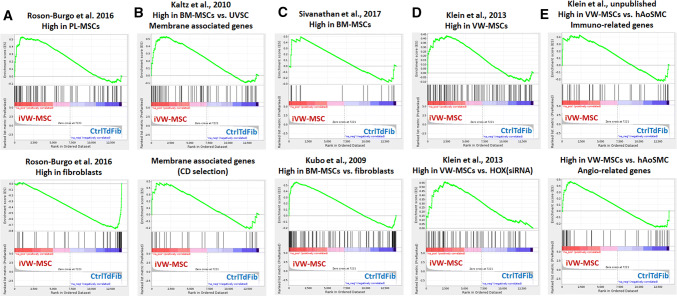
Fig. 5.
Gene Expression Profiling of iVW-MSCs. a GSEA was performed using gene sets specific for different MSCs. Genes highly expressed in human MSC derived from placental tissue (PL-MSC) as compared to human skin fibroblasts were used [64]. b Membrane-associated genes (top panel) and a CD selection (bottom panel) highly expressed in bone marrow-derived MSC (BM-MSC) as compared with stromal cells derived from umbilical veins (UVSC) were used [116]. c Genes highly expressed in untreated BM-MSC as compared to (pre-activated) IFN- treated BM-MSC (top panel) [117], as well as genes expressed selectively in BM-MSC compared with fibroblasts, osteoblasts, chondrocytes and adipocytes [118]. d Genes highly expressed in VW-MSC compared to VW-MSCs upon HOX silencing were used [49]. Top panel represents all significantly altered genes upon HOX gene silencing; bottom panel represents genes highly expressed in VW MSC as compared to those downregulated in VW-MSCs upon HOX silencing. e Genes highly expressed in VW-MSC as compared to human aortic smooth muscle cells (hAoSMC) were used (unpublished data set). cDNA microarray analysis using AffymetrixH DNA chips was performed to identify potential VW-MSC markers as compared to the mature vascular wall cells. Resulting significantly different expressed genes were grouped according to gene ontology and genes involved in the immune response (54 genes in total of which 34 genes were highly upregulated in VW-MSCs) as well as involved in angiogenesis (56 genes in total of which 22 genes were highly upregulated in VW-MSCs) were used as gene sets. Genes were drawn according to their rank from left (high expression in iVW-MSCs) to right (high expression in Ctrl) and gene sets plotted on top with each black bar representing a gene. The enrichment score is plotted in on the vertical axis. Specific gene sets were listened in the Supplementary Table S4

