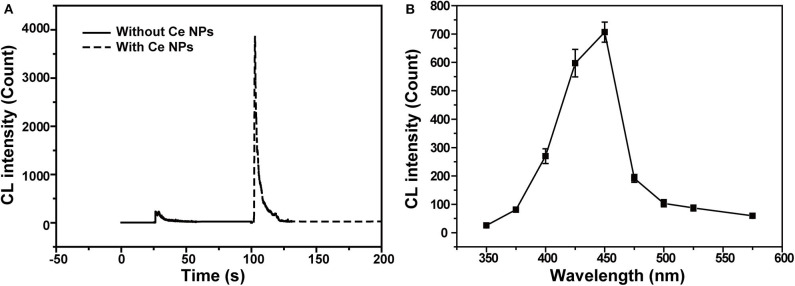
Figure 2.
CL profiles of the LaF3:Ce NPs-NaNO2-H2O2 system. (A) Comparison of CL intensities of the NaNO2-H2O2 system with and without LaF3:Ce NPs. (B) CL spectrum of the LaF3:Ce NPs-NaNO2-H2O2 system. The standard error bars mean the variation of three individual experiments. Conditions: 3.00 M H2O2 in 0.04 M H2SO4, 50 μl of LaF3:Ce NPs and 10 μM NaNO2 solution. Voltage of the PMT was set at 1.2 kV.

