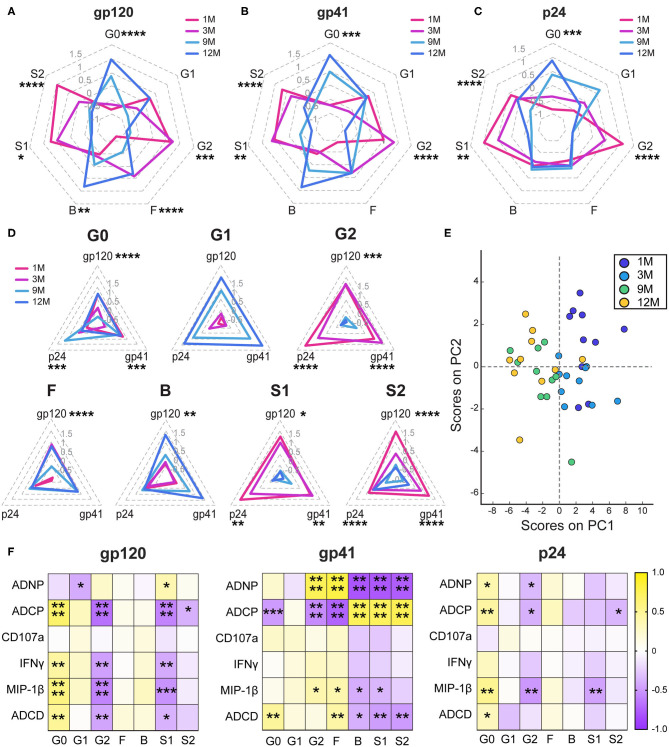
Figure 2.
Antibody glycosylation changes following acute infection. (A–C) Radar plots depict the relative amounts of each monosaccharide on antigen-specific antibody Fc glycans. Glycans were determined by summing the percentages of each of 24 individual glycan peaks that display a given quality. G0, agalactosylated; G1, monogalactosylated; G2, digalactosylated; F, fucosylated; B, bisected with N-acetylglucosamine; S1, monosialylated; and S2, di-sialylated. Glycans percentages are normalized to an average of 0 and a standard deviation of 1 and the average of the 10 participants at each timepoint is graphed. Radars are labeled from 1.5 to −1 in gray. (D) Radar plots show the gp120-, gp41-, and p24- specific responses for each glycan attribute. Radars are labeled from 1.5 to −0.5 in light gray. (E) Principal components analysis of glycans was colored by timepoint. PC1 describes 50.4% of the variance and PC2 describes 11.4% of the variance. (F) Heatmaps show the r value of the Spearman correlation between function and glycan for all four timepoints. Statistics for radar plots evaluated as using one-way ANOVA. Heatmap generated with Spearman correlation. *p < 0.05, **p < 0.01, ***p < 0.01, and ****p < 0.001.

