Figure 2.
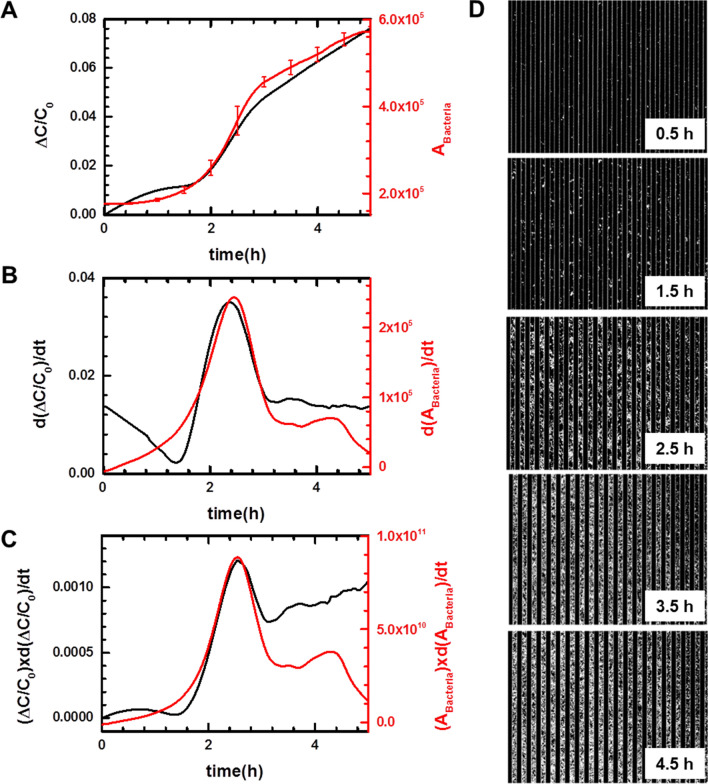
(A) Time dependence of normalized capacitance change (ΔC/C0, black curve) and the area occupied by bacteria (ABacteria, red curve) when E. coli U433 was cultured. (B) d(ΔC/C0)/dt (black curve) and d(ABacteria)/dt (red curve) numerically calculated from the data shown in (A). (C) (ΔC/C0) × d(ΔC/C0)/dt (black curve) and (ABacteria) × d(ABacteria)/dt (red curve). (D) Time-lapse phase contrast optical images acquired when E. coli U433 was cultured in a Chamlide chamber.

