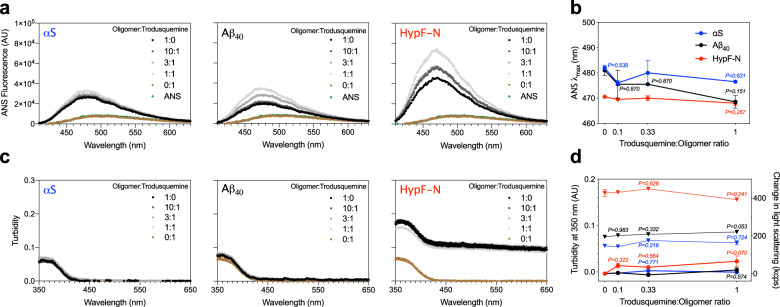
Fig. 4. The concentrations of trodusquemine used in the cell experiments do not appreciably modify the biophysical properties of αS, Aβ40, and HypF-N oligomers.
a Oligomers of αS, Aβ40 and HypF-N were incubated at a concentration of 5 µM in the absence (black) and presence of 10:1, 3:1, and 1:1 ratios of oligomers to trodusquemine (dark to light gray) and monitored for the binding of ANS. Free ANS (green) and ANS + 5 µM trodusquemine (brown) are shown for comparison. b The wavelength of maximum ANS fluorescence (λmax) for oligomers of αS (blue), Aβ40 (black), and HypF-N (red) in the presence of increasing concentrations of trodusquemine. c Turbidity absorbance measurements for the conditions described in a. d Turbidity values from c quantified at 350 nm (triangles, left y-axis). Change in static light scattering (kilocounts per second, kcps) after oligomer incubation in the presence of increasing concentrations of trodusquemine for the conditions described in b (dots, right y-axis). Static light scattering data indicate the mean ± s.e.m. of n = 3 technical replicates. In a–c, data indicate mean ± s.e.m. of n = 2 spectra. ANS and turbidity spectra are representative of three independent experiments that yielded consistent results. In b, d, P > 0.999 except where indicated (one-way ANOVA relative to oligomers in the absence of trodusquemine) with the aforementioned color codes and number of technical replicates.

