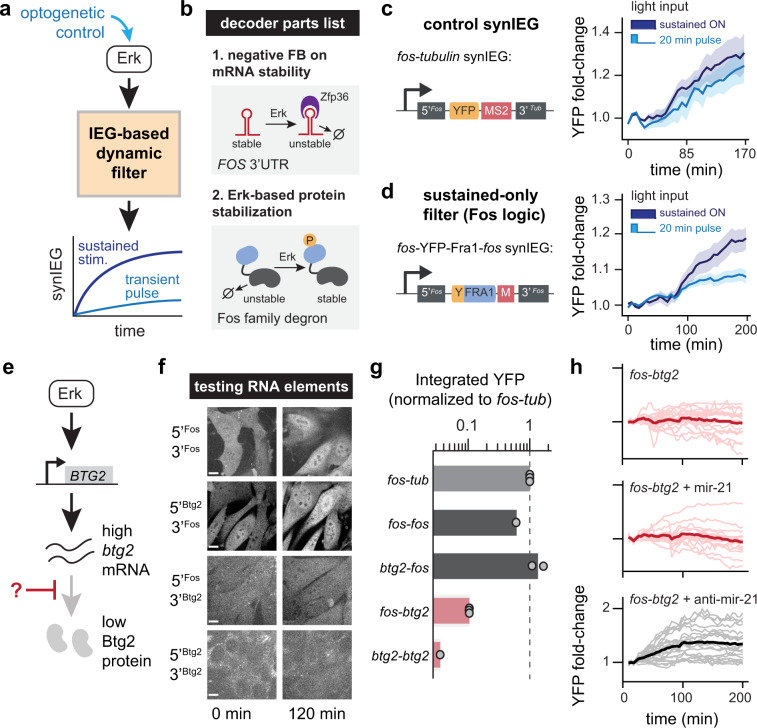
Fig. 3. SynIEGs can be used to implement dynamic and combinatorial decoding circuits.
a Schematic of platform to test whether a synthetic immediate-early gene regulatory circuit could recapitulate dynamic filtering by the FOS immediate-early gene using the OptoSOS optogenetic system for applying dynamic stimuli (see Supplementary Fig. 5). b Parts list of the sustained-only dynamic filter. The FOS 3′ UTR is subject to degradation by a second Erk-induced immediate-early gene, Zfp36 (upper panel). Protein levels are stabilized by Erk phosphorylation of a Fos-family degron sequence (lower panel). c, d Quantification of YFP induction as a function of light stimulus duration for the fos-tubulin SynIEG (in c) and the fos-Fra1deg-fos SynIEG implementing Fos-specific mRNA- and protein-level regulation (in d). The fold-change in YFP fluorescence was quantified from NIH 3T3s that also expressed the iLID-OptoSOS system and were stimulated with either transient (20 min) or sustained (90 min) blue light. All curves indicate the mean ± SEM for n = 10 cells (panel c, sustained), n = 6 cells (panel c, transient), n = 22 cells (panel d, sustained), and n = 23 cells (panel d, transient). e Schematic of combinatorial control over BTG2 induction: Erk stimulation induces btg2 transcription but not protein accumulation, whereas DNA damage induces both. The mechanism underlying this difference is unknown. f Representative images of YFP levels in NIH3T3 clonal lines expressing various SynIEGs and stimulated with 10% serum. Images show YFP levels just before and 3 h after serum stimulation and scale bar is for 10 μm. g Quantification of the area under the curve (AUC) of YFP induction after serum stimulation for the clonal SynIEG cell lines shown in f, as well as for fos-tubulin as an additional control (see Methods for quantification details). Each point represents the average of 20–30 cells from an independent experiment. h Quantification of YFP fluorescence in NIH3T3 cells harboring the fos-btg2 SynIEG and stimulated with 10% serum after being transduced with nothing (n = 20 cells), miR-21 (n = 17 cells), or the miR-21 sponge (n = 21 cells). Single-cell traces are shown in lighter color, with the mean response shown as a bold line. Additional clones tested for miR-21 effect are shown in Supplementary Fig. 8.

