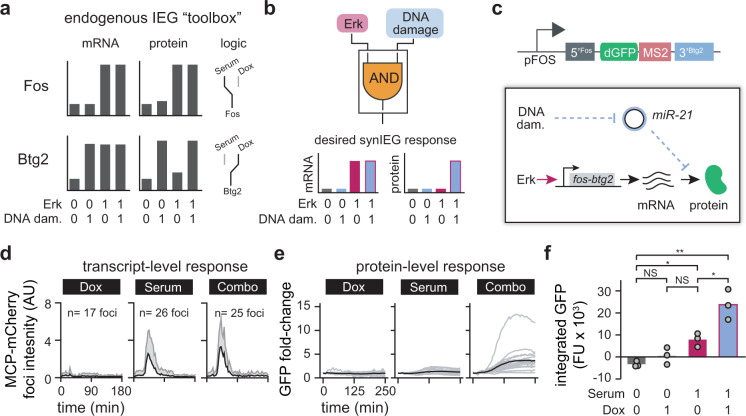
Fig. 4. A SynIEG-based AND gate triggers target gene expression in response to Erk and DNA damage.
a Cartoon schematic of prior knowledge of FOS and BTG2 regulation in response to growth factor stimulation (serum) and DNA damage (doxorubicin; Dox). Fos transcription and protein accumulation are both triggered by serum stimulation irrespective of DNA damage (upper panels). In contrast, btg2 transcription is induced by both DNA damage and serum stimulation, yet only DNA damage triggers Btg2 protein accumulation. b Schematic of a synthetic AND gate responding to both serum stimulation and DNA damage. By combining a FOS-like transcriptional response with a BTG2-like protein response, target gene induction would be triggered only when both stimuli are supplied. c Experimental implementation of the AND-gate SynIEG. Transcription of the fos-btg2 SynIEG is induced only by serum stimulation, not DNA damage, due to its use of the FOS promoter. However, DNA damage is required for protein accumulation through the use of the BTG2 3′UTR. d Transcriptional response of the fos-btg2 SynIEG. The brightness of individual nuclear MCP-mCherry foci was quantified (mean + SD) in cells treated with doxorubicin (n = 17 foci, 17 cells), serum (n = 26 foci, 12 cells), or their combination (n = 25 foci, 10 cells). e GFP induction from the fos-btg2 SynIEG. Nuclear dGFP levels were quantified from cells stimulated with doxorubicin, serum, or their combination. Single-cell traces are shown in gray, with the mean response shown as a black line. f Quantification of the area under the curve (AUC) of dGFP induction for the clonal SynIEG cell lines shown in d and e after stimulation with serum, doxorubicin, or their combination (see “Methods” for quantification details). Each point represents the mean of at least 20 cells in a single experiment, with each bar representing the mean of three independent replicate experiments. Statistics are derived using an unpaired two-sided t-test (*p < 0.05, **p < 0.01, ***p < 0.001).

