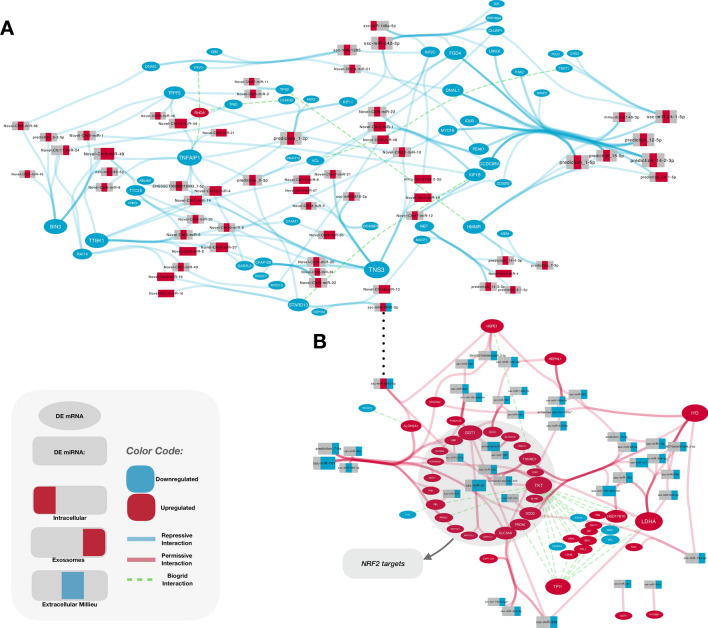
Figure 5.
Interaction networks of DE miRNAs and genes involved with cytoskeleton/cilia and redox homeostasis. Rectangles depict miRNAs and ellipses represent genes. Blue ellipses/rectangles indicate that the gene/miRNA was down-regulated and red indicate gene/miRNAs detected as up-regulated. BioGrid interactions are seen as green dashed arcs. These represent both physical and genetic interactions between either genes or proteins from such genes. A. Cytoskeleton/cilia interaction network. We detected many repressive interactions involving genes related to cytoskeleton and ciliary function (blue arcs). B. Redox homeostasis interaction network. Permissive interactions of genes related to redox homeostasis are shown as red arcs. The great majority of the miRNAs targeting these genes are DE only in exosomes (rectangles partially colored in blue, far right). NRF2 targets: genes described in other species to be activated by NRF2 are highlighted in grey.

