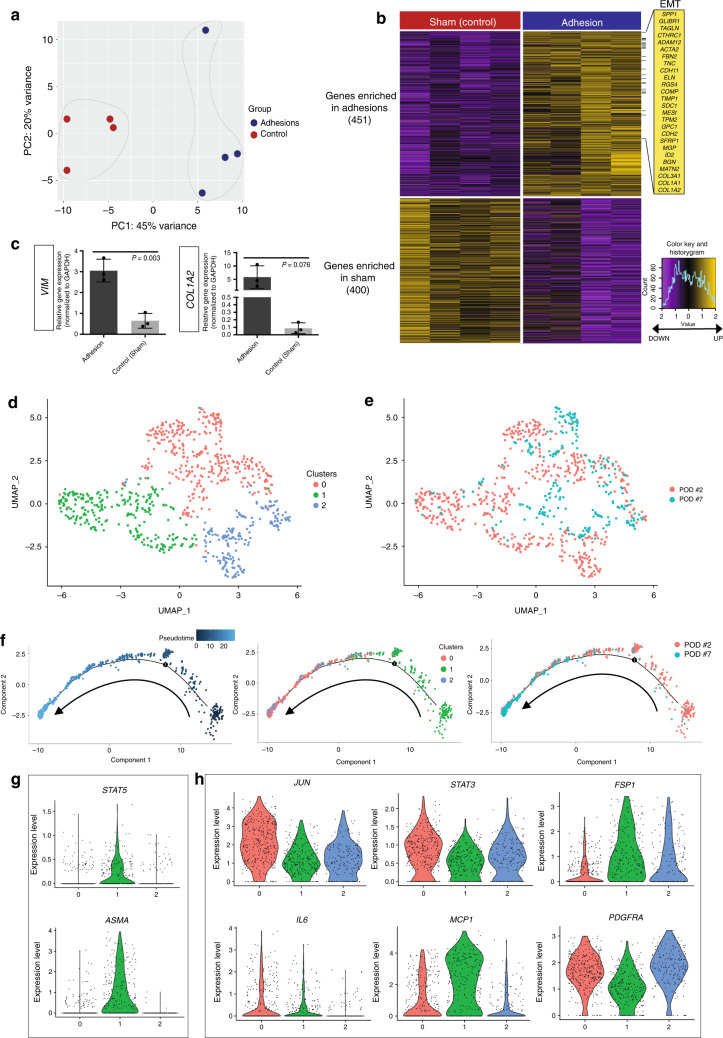
Fig. 4. Adhesion fibroblasts upregulate EMT and show heterogeneity.
a Principal component analysis (PCA) plot comparing bulk RNA-seq gene expression for adhesion (n = 4) and control peritoneum (n = 4) FACS-isolated mouse fibroblasts. Colors as labelled, variances noted on plot. b Heatmap of mouse adhesion-forming fibroblast bulk RNA-seq data shows significant differential gene expression between adhesion and control peritoneum (sham surgery) cohorts. Upregulated EMT-pathway genes noted at right. Gene enrichment as noted in figure, color key, and histogram at far right. c Quantitation of qPCR for vimentin (VIM) and collagen 1a2 (COL1A2) shows upregulation of gene expression in the context of mouse abdominal adhesions. Data and error bars represent means ± SD; P-values noted in figure, unpaired two-tailed t-test. n = 3 replicates per condition, datapoints represent average of technical replicates. d Uniform manifold approximation and projection (UMAP) plot showing single-cell (sc) RNA-seq data from mouse adhesion fibroblasts FACS-isolated using an unbiased, lineage-negative sort strategy at POD 2 (n = 4) and POD 7 (n = 4) following adhesion induction. Three unique clusters of fibroblasts are identified. Colors as labelled in the figure panel. e UMAP plot showing distribution of mouse scRNA-seq fibroblasts in terms of harvest timepoint relative to the clusters in panel d. Cells isolated at both timepoints are represented in all clusters. Colors as labelled in the figure panel. f Pseudotime analysis (Monocle 2) of mouse scRNA-seq data: Pseudotime analysis (left panel), representation of scRNA-seq clusters across the pseudotime analysis shows a clear progression from cluster 1 to clusters 0 and 2 (middle panel) and relative to timepoints, the cells follow a logical time progression that mirrors the pseudotime with the largest representation of POD 2 cells in cluster 1 and more POD 7 cells in clusters 0 and 2 (right panel). Arrows indicated direction of pseudotime progression. g Violin plots showing expression of STAT5 and ASMA within the scRNA-seq data. Colors and numbering on x-axis match cluster colors assigned in panel d. h Additional violin plots showing expression of JUN, STAT3, FSP1, IL6, MCP1, and PDGFRA relative to the scRNA-seq data clusters seen in panel d. Colors and numbering on x-axis match cluster colors assigned in panel d. Source data are provided as a Source Data file.

