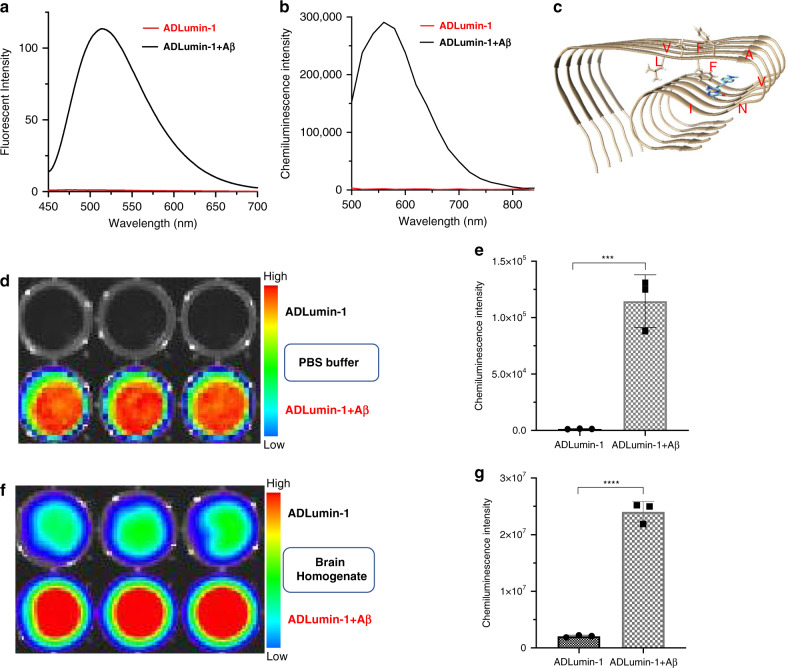
Fig. 3. In vitro characterization of fluorescence and chemiluminescence properties of ADLumin-1 in the presence of Aβs.
a Fluorescence spectra of ADLumin-1 alone (red) and with Aβ40 aggregates (black); b Chemiluminescence spectra of ADLumin-1 alone (red) and with Aβ40 aggregates (black); c Molecule docking of ADLumin-1 (blue) with Aβ fibrils (PDB:5OQV). d In vitro chemiluminescence images of ADLumin-1 alone and with Aβ40 aggregates in PBS. e Quantification of chemiluminescence intensity in d. f In vitro chemiluminescence images of ADLumin-1 alone and with Aβ40 aggregates in mouse brain homogenate; g Quantification of chemiluminescence intensity in f. Data are represented as mean ± s.d. with n = 3 biologically independent samples. P = 0.0005 (e), P < 0.0001 (g). The P-values were generated by Graphpad Prism 8 with two-tailed unpaired t-test; ***P-value < 0.001, ****P-value < 0.0001. Source data underlying e and g are provided as Source Data file.

