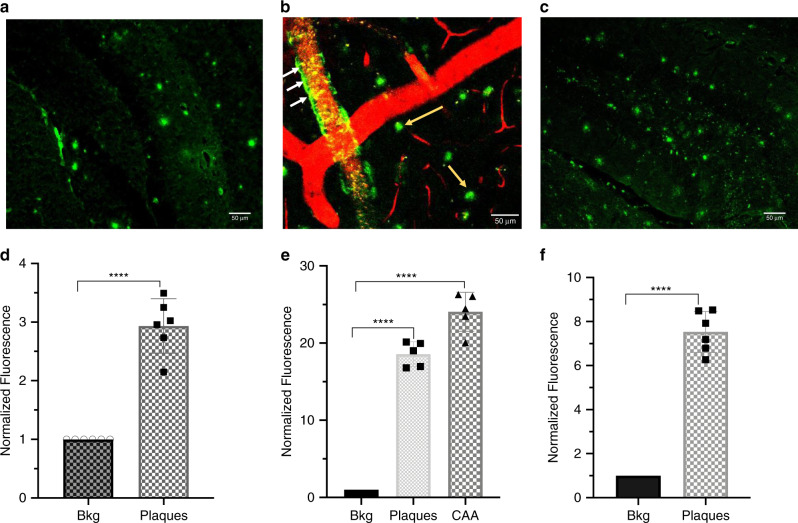
Fig. 5. In vitro and in vivo plaques imaging with ADLumin-1.
a Representative brain slice image of cortex area of a 24-mo-old APP/PS1 mouse with ADLumin-1 staining; b Two-photon microscopic image of brain cortex area with ADLumin-1 in an alive 15-mo-old 5xFAD mouse. The blood vessels were highlighted by Rhodamine B isothiocyanate-Dextran, and the presentative image is merged images from two concurrent imaging channels. The yellow arrows indicate plaques, and the white arrows indicate CAA labeling; Scale bar: 50 μm. c Ex vivo histology of a mouse brain slice obtained after the two-photon imaging with ADLumin-1. d–f Quantitative analysis of SNR of plaques of in vitro slice (d) (mean ± s.d., n = 6 independent measurements), in vivo plaques (mean ± s.d., n = 5 independent measurements) and CAAs (mean ± s.d., n = 5 independent measurements) (e), and ex vivo plaques (mean ± s.d., n = 6 independent measurements) (f). P < 0.0001 (d); P < 0.0001 (e); and P < 0.0001 (f). The P-values were generated by Graphpad Prism 8 with two-tailed unpaired t-test; ***P-value < 0.001, ****P-value < 0.0001. Bkg background, CAA cerebral amyloid angiopathy. Source data underlying d–f are provided as Source Data file.

