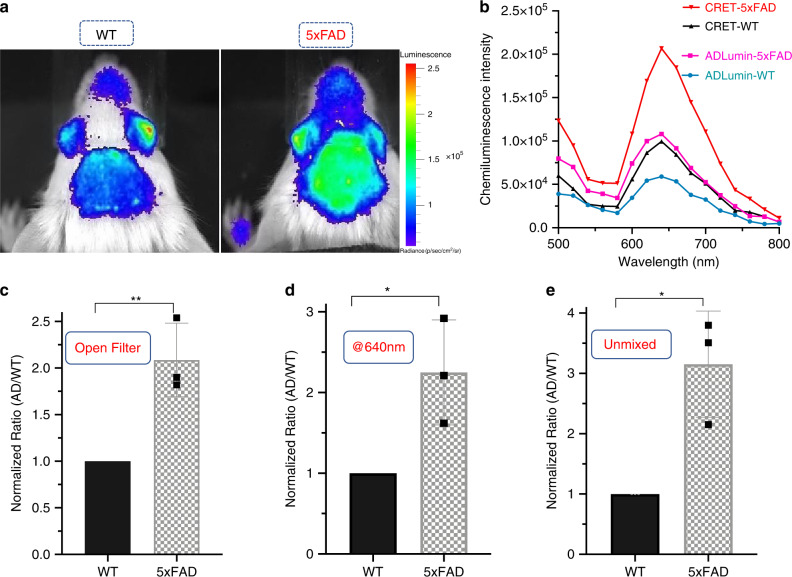
Fig. 9. In vivo DAS-CRET imaging.
a In vivo brain imaging of WT and 5XFAD mice with mixture of ADLumin-1 and CRANAD-3; b In vivo emission spectra of CRET pair (red line-5xFAD) and control (black line-WT), and ADLumin-1 only (pink line-5xFAD) and ADLumin-1 only control (blue line-WT); c–e Quantitative analysis of the images with CRET pair with the setting of open filter (c), at 640 nm (d) and after spectral unmixing (e). Data are represented as mean ± s.d. with n = 3 biologically independent animals. P = 0.0059 (c), P = 0.0292 (d), P = 0.0133 (e). The P-values were generated by Graphpad Prism 8 with two-tailed unpaired t-test; *P-value < 0.05, **P-value < 0.01. Source data underlying c–e are provided as Source Data file.

