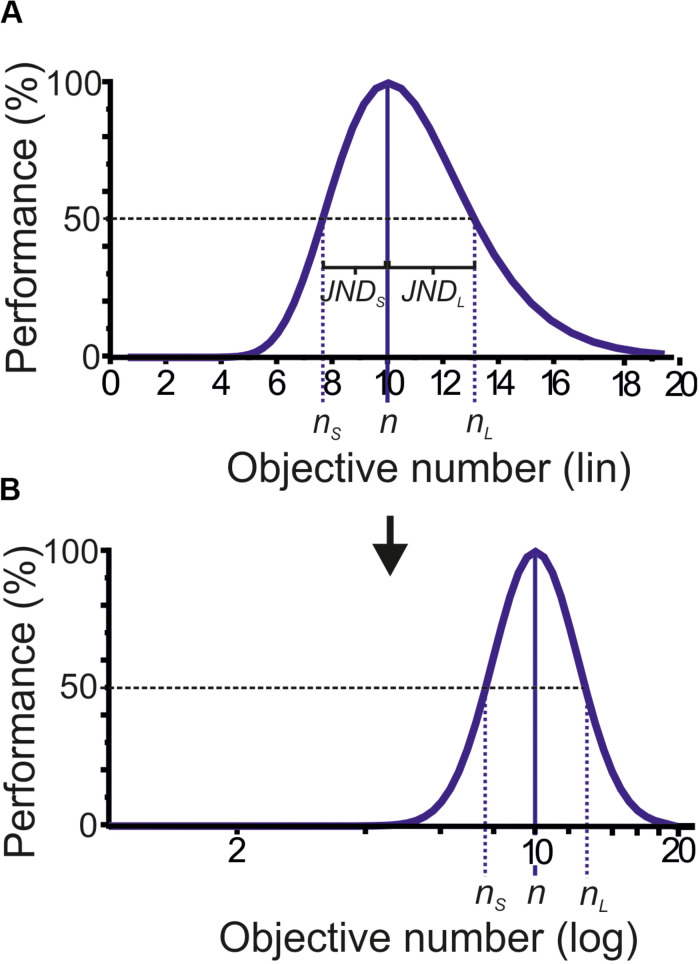
FIGURE 2.
Ideal numerosity performance function. (A) Ideal numerosity performance function for target numerosity 10 plotted on a linear number scale (top graph). The function shows a steeper slope toward smaller, and a shallower slope toward higher numerosity. As a result, the just-noticeable difference (JND, indicated by dotted colored lines) at which numerosities smaller (nS) and larger numerosities (nL) can be discriminated in 50% from the target (n) is smaller on the left compared to the right side of the function. (B) When the same function is plotted on a logarithmic number scale, the function becomes symmetric and the JNDs are equal on either side of the function (bottom graph).

