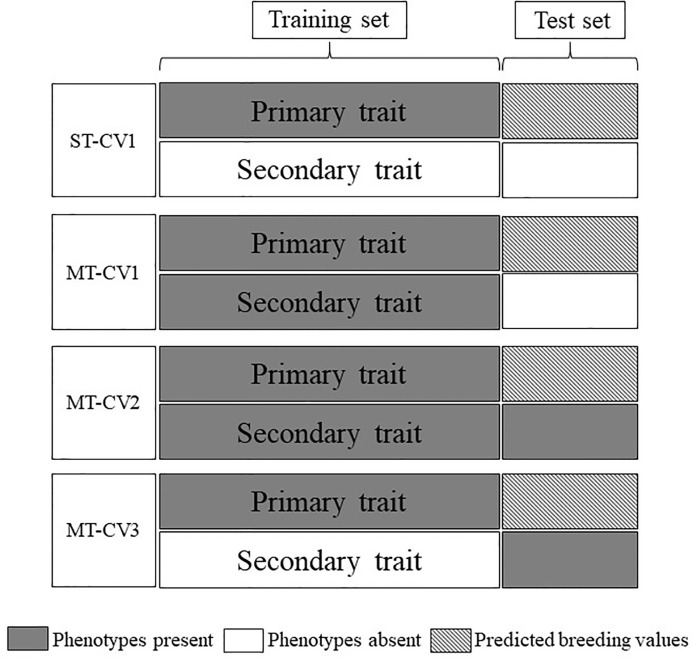
Figure 1.
Cross-validation schemes employed for single-trait (ST) and multi-trait (MT) genomic prediction models. Data were divided into training and test sets. Gray boxes indicate phenotypes were present in the model and white boxes indicate the absence of phenotypes. Hatched boxes indicate the primary trait was predicted in the test set using either ST or MT models.

