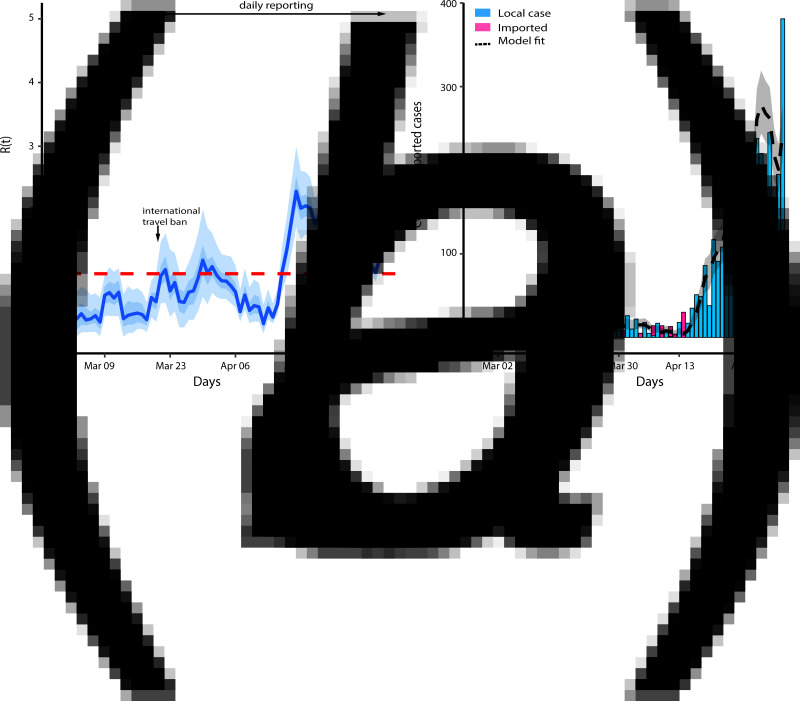
Fig. 1.
(a) Baseline effective reproduction number. The light and dark blue colour show 95% and 50% credible interval, respectively, and the solid line is the median estimate. (b) R(t)model fit. The black dashed line is the median estimation of the local cases and the grey area shows a 95% credible interval of the estimated local cases.

