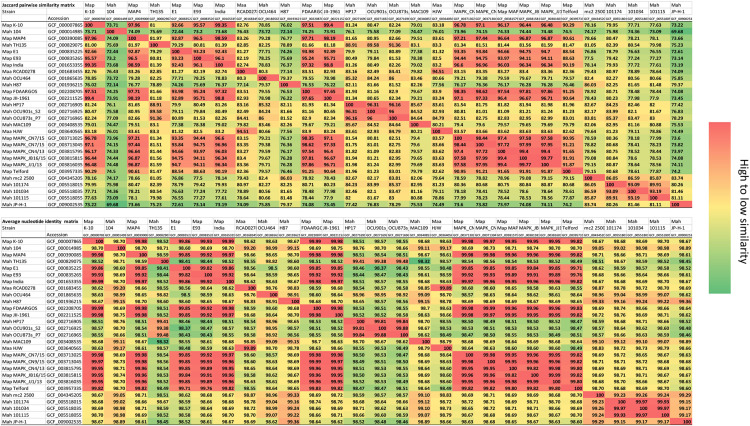
FIGURE 1.
Nucleotide level similarity analysis. The top matrix shows the Jaccard pairwise cluster similarity and the bottom matrix show the average nucleotide identity (ANI). The ANI values are a similarity index between two genomes expressed as a percentage. Jaccard percentages were obtained by direct pairwise genome comparisons using PanOCT as described in the methods. Note that the Jaccard similarity has a much broader range of values. The strain names and corresponding RefSeq accession numbers are shown in both matrices. Heat map shows high similarity in red versus lower values in green.

