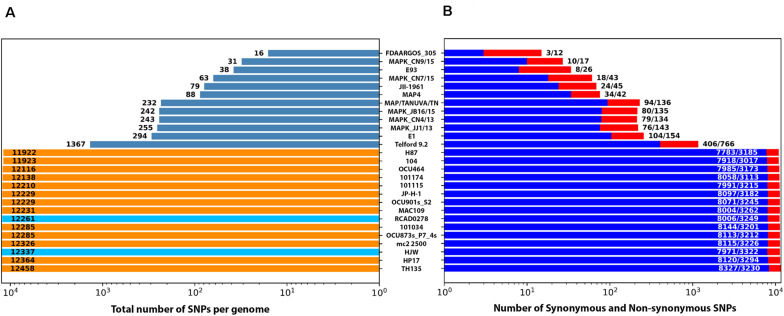
FIGURE 2.
Number of single nucleotide polymorphisms among all 28 M. avium subspecies genomes using Map K-10 as the reference genome. Shown are the total number of SNPs detected in each strain (A) with the slate bars representing Map, beige bars representing Mah and light blue bars representing Maa strains. (B) The number of synonymous (blue bars, first value) and non-synonymous (red bars, second value) SNPs. Both graphs were plotted on a log scale with the strain designation listed in the center. Numerical differences between total SNPs and the combined nonsynonymous plus synonymous SNPs represent the intergenic SNPs.

