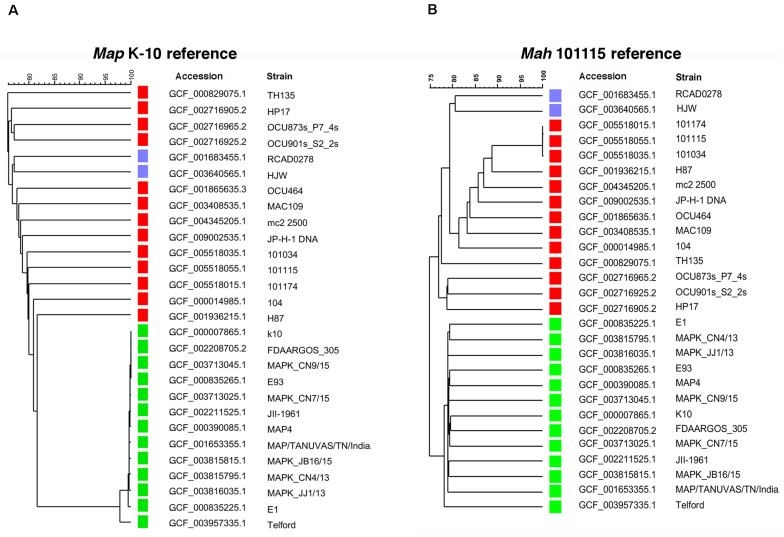
FIGURE 3.
UPGMA phylogenetic tree based on the total 65401 single nucleotide variants detected in all M. avium strains using Map K-10 as the reference (A) or based on the total 69324 SNPs detected using Mah 101115 as a reference (B). The green squares represent Map stains while red and blue represent Mah and Maa strains, respectively. Scale at the top represents percent identity.

