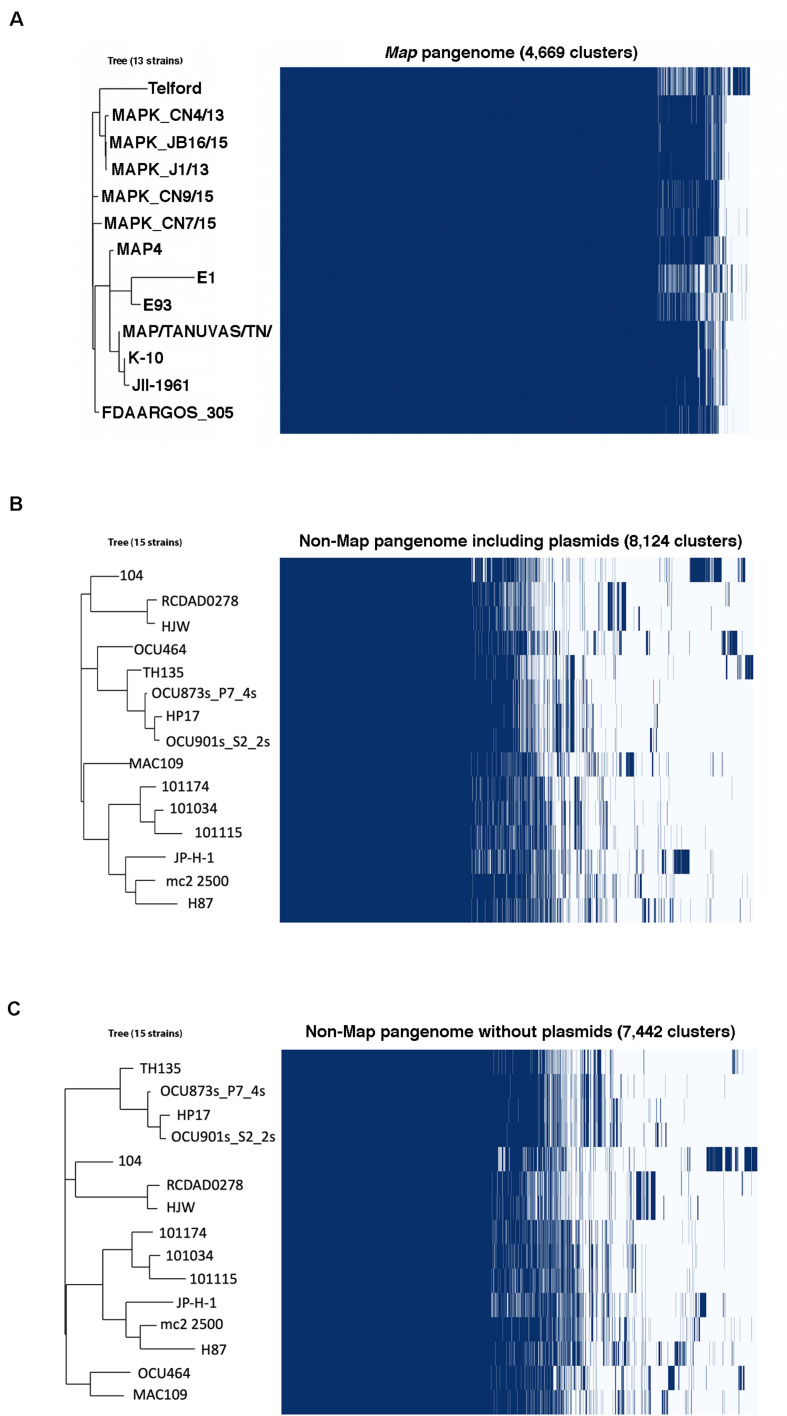
FIGURE 6.
Gene presence matrix of the Map (A) and non-Map pangenomes analyzed with (B) and without (C) plasmid DNA elements. At the right of each panel is a compressed gene cluster matrix where blue blocks indicate presence of the gene in that cluster and white indicates its absence. Each column represents an orthologous gene family. The corresponding phylogenetic tree is presented on the left and strains listed on the tree correspond to each row of the matrix. Only the phylogeny of OCU464 is affected by the presence/absence of plasmid DNAs among the non-Map strains (compare B and C). Note the discrepancy of the core genome between Map and non-Map. Fully 80% of the Map genome consists of core genes.

