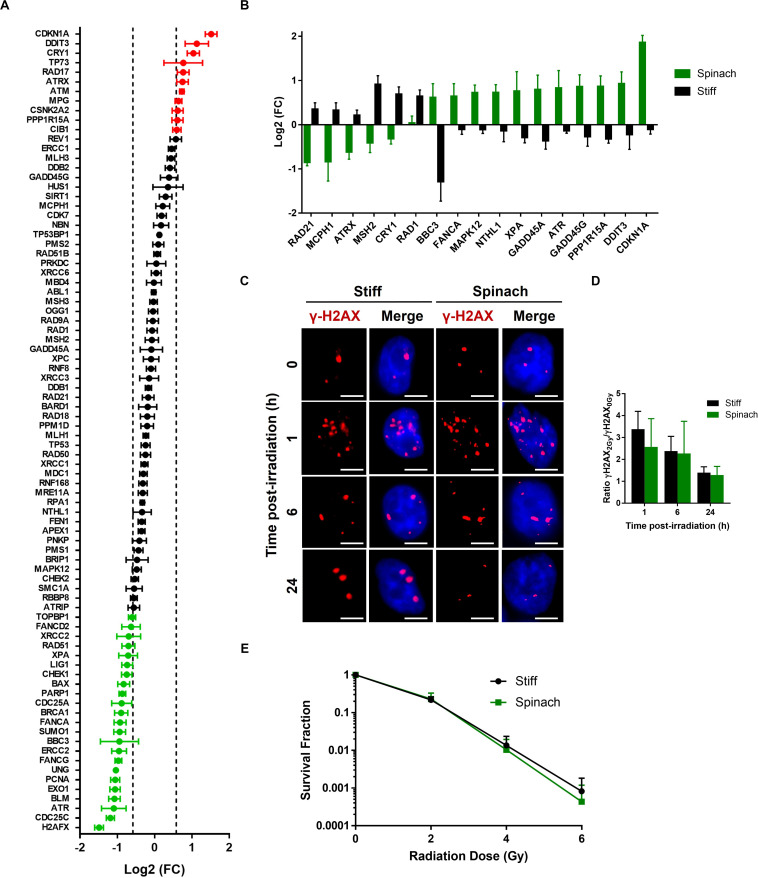
FIGURE 5.
Radiation response of PC3 cells cultured on decellularized spinach leaf. (A) Graph showing differentially expressed genes between PC3 cells seeded on the leaf and TCPS. A total of 84 genes values have been measured (including black, red and green dots). 35 genes have | log2(FC)| > 1.5 and p-value < 0.05 (up-/downregulated genes, red/green dots, respectively). Data points are represented as the mean ± SEM (n = 3). (B) Graph showing genes that are differentially expressed between PC3 cells seeded on the leaf and TCPS at 6 h after 2 Gy-irradiation. Data points are represented as the mean ± SEM (n = 3). (C) Representative nuclei of PC3 cells cultured on leaf with γ-H2AX foci at 1, 6, and 24 h after 2 Gy irradiation (n = 3). Scale bar = 6 μm. (D) Histograms showing the ratio of number of 2 Gy-irradiated γH2AX foci normalized to sham-irradiated samples, in PC3 cells seeded on spinach leaf or stiff substrate (coverslip). Data points are represented as the mean ± SEM of at least 100 nuclei (n = 3). (E) Cell survival curves of PC3 cells cultured on leaf and in TCPS as assayed by colony-forming ability. Colonies with more than 50 cells were scored. Data are represented as mean ± SEM (n = 3).

