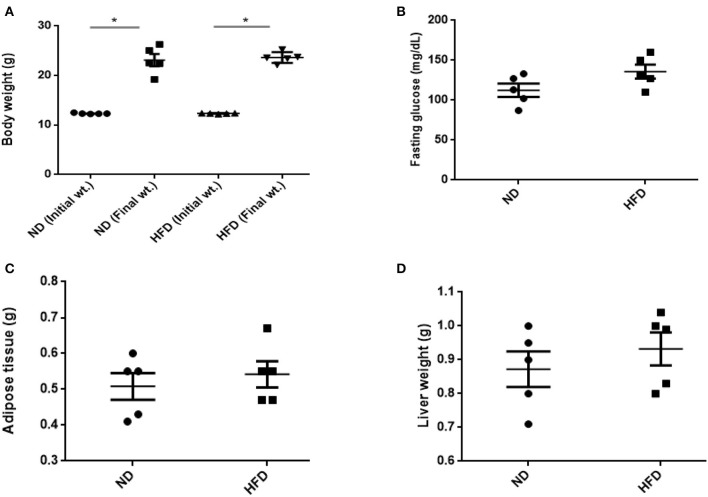
Figure 1.
Effect of normal diet (ND) and high-fat diet (HFD) feeding for 8 weeks on various parameters: (A) body weight, (B) fasting glucose level, (C) weight of adipose, and (D) liver tissue. All values are mean ± SEM (n = 5). Columns marked with asterisk are significantly different (P < 0.05) to its counterpart, whereas symbol ns represents the no significant difference.

