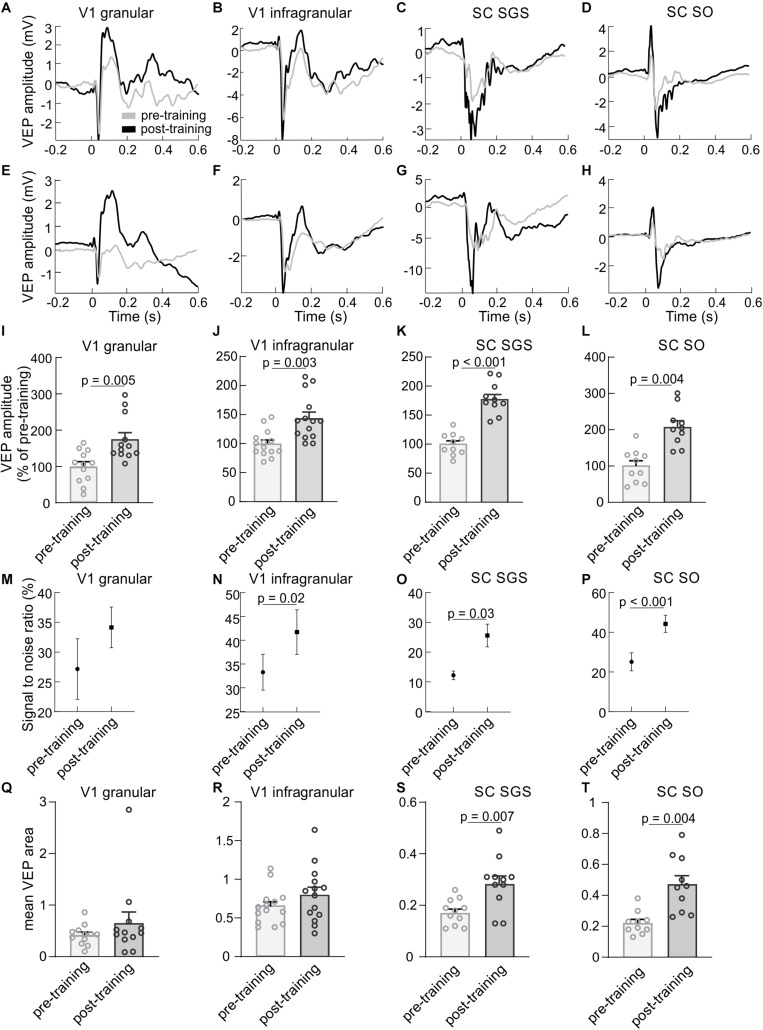
FIGURE 2.
Visual training enhances visually evoked responses in the V1 and the SC. The first column presents results for a granular layer of the V1, second column for infragranular layers for the V1, the third column for the SGS layer and the last column for the SO layer of the SC. (A–D) Average VEPs (n = 100) recorded in the V1 and SC for a single experiment before (gray line) and after (black line) visual training for the same animal. (E–H) Average responses in the V1 and SC for all rats before and after visual training. Time 0 is a stimulus onset. (I–L) Comparison between the average pre- (gray bars) and post-training (black bars) VEP amplitudes for the V1 and SC. (M–P) Signal to noise ratio changes for pre- and post-training recordings for the V1 and SC. (Q–T) Comparison of VEP areas of pre- and post- training evoked potentials.

