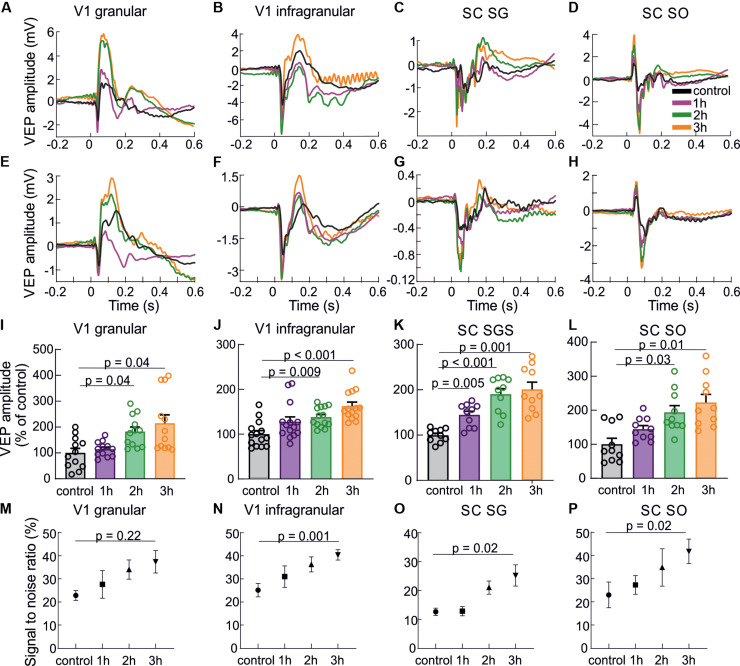
FIGURE 3.
Response enhancement during visual training. The results are presented in the following order: the first column shows the results for a granular layer of the V1, second column for infragranular layers for the V1, the third column for the SGS layer and the last column for the SO layer of the SC. (A–D) VEPs for each hour of visual training recorded in different layers of the V1 and the SC for a single experiment. (E–H) Average population responses for each hour (every fourth sensory stimulation) during visual training recorded in different layers of the V1 and the SC and encoded by different colors. (I–L) Mean VEP amplitudes for all rats and every hour of visual training for the V1 and SC. (M–P) Signal to noise ratio changes for every hour of visual training for all layers.

