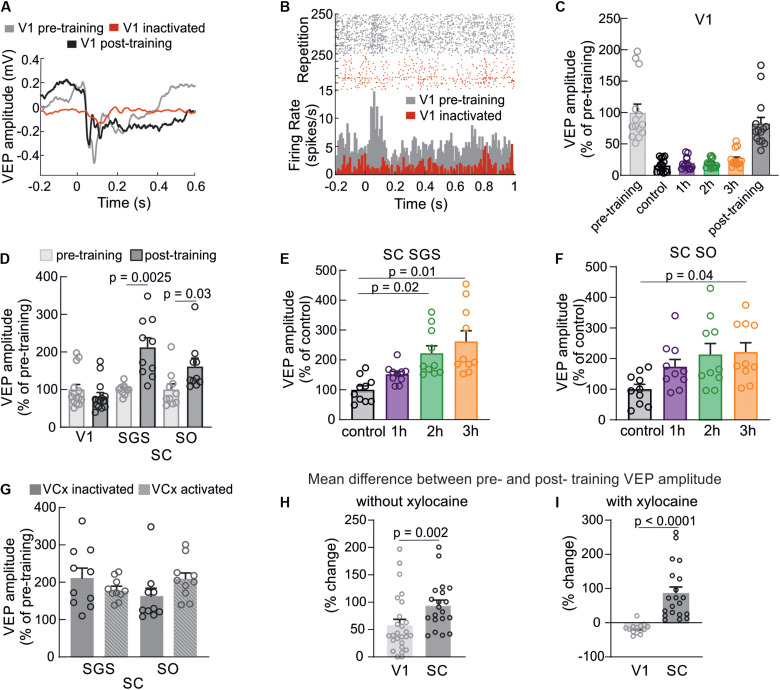
FIGURE 4.
Cortical inactivation does not affect plasticity in the SC. (A) Typical example of the visual cortex VEP recorded from the single experiment before (gray line), during visual training when xylocaine was applied (red line), and after training when xylocaine was washed out (black line). (B) Raster plots and histograms of multi-unit spiking activity showing reduced spiking activity and lack of response in the V1 during xylocaine application. (C) Silencing of cortical responses during visual training as a result of xylocaine application. (D) Comparison of average responses before (gray) and after (black) visual training in the V1, SGS, and SO layers of the SC when cortical activity was suppressed. (E,F) Average response amplitudes in the SC (SGS and SO, respectively) for every hour of the visual training while V1 silencing. (G) Comparison of mean values of post-training VEP amplitudes in the SC between two experimental conditions: with V1 active (n = 10) and V1 inactive (n = 10). (H) The comparison of mean differences between pre- and post- training potential amplitudes for V1 and SC without xylocaine. (I) The same comparison as in H, when xylocaine was used to silence the V1 during training.

