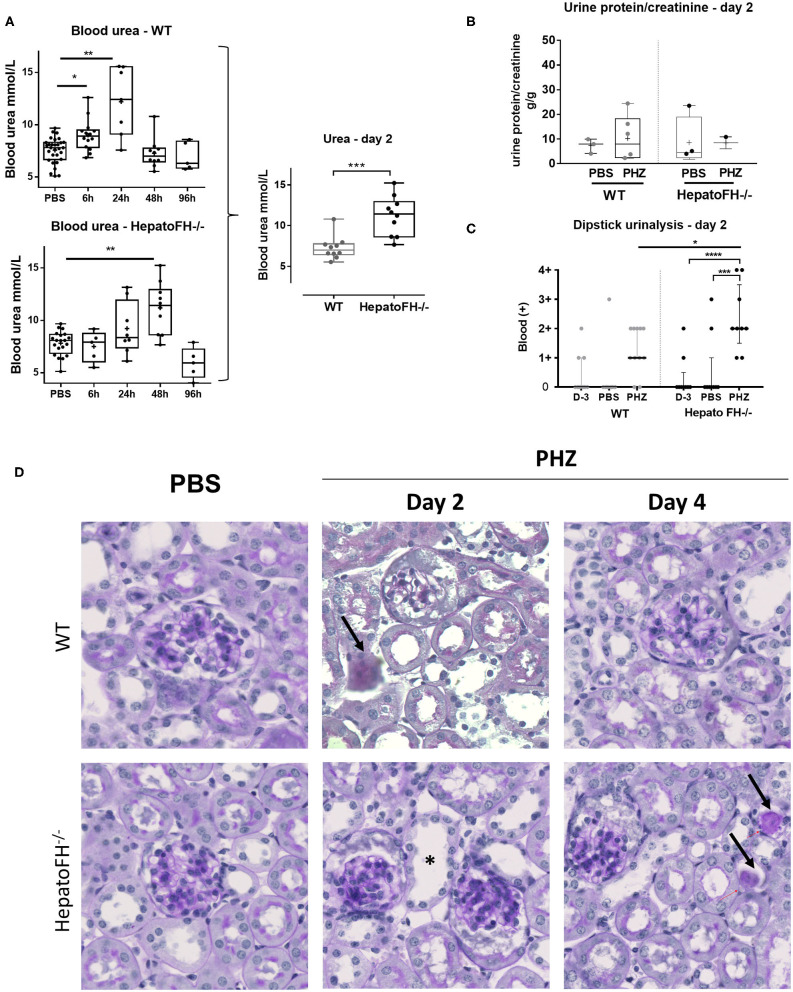
Figure 1.
Hemolysis induces clinicopathologic changes in HepatoFH−/− kidneys (A–C). Evaluation of renal function by measurement of plasmatic urea level (A), urine protein-creatinine ratio (B) and presence of blood in urine by urinary dipstick (C) in WT and hepatoFH−/− mice, at 6, 24, 48, and 96 h after PBS or PHZ injection. The dipstick scale is in Figure S2. (D) PAS coloration of paraffin-embedded renal section (x40) after PBS or PHZ injection in WT (upper panel) hepatoFH−/− (bottom panel) mice. Black arrows are showing the presence of casts inside the tubules. Asterix shows tubular injury with tubule dilation and loss of brush border. No significant changes are seen inside the glomeruli. P-values are derived from Two way ANOVA test with Sidak test correction: *p < 0.05, **p < 0.005, ***p < 0.001, ****p < 0.0001. The quantification values are box plots and dots with median and Min/Max points. Data from four independent experiments, each experimental group containing between 5 and 10 mice were pooled. PBS groups are composed of PBS-treated mice from each time points assessed with PHZ treatment. PBS-treated mouse were statistically equivalent from one another when analyzed over time. D, day.

