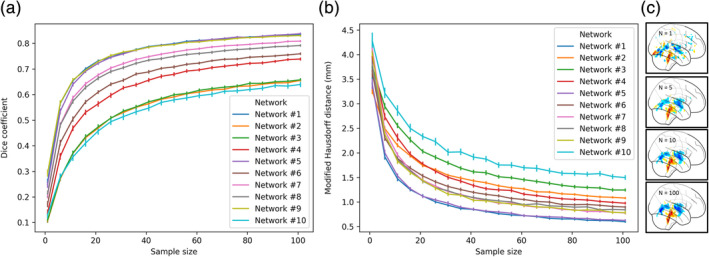
FIGURE 5.

The split‐sample similarity of the explanation maps as a function of sample size. The similarity of two maps produced from an increased sample size from two separate groups (n = 100 for each group) was measured using (a) Dice coefficient and (b) MHD (mm). The results are reported for all 10 CNNs and each is presented in a separate color. (c) A visual illustration of an explanation map for network 1 produced by increasing the sample size (from top to bottom, N = 1,510,100). The error bars represent a 95% confidence interval
