Figure 3.
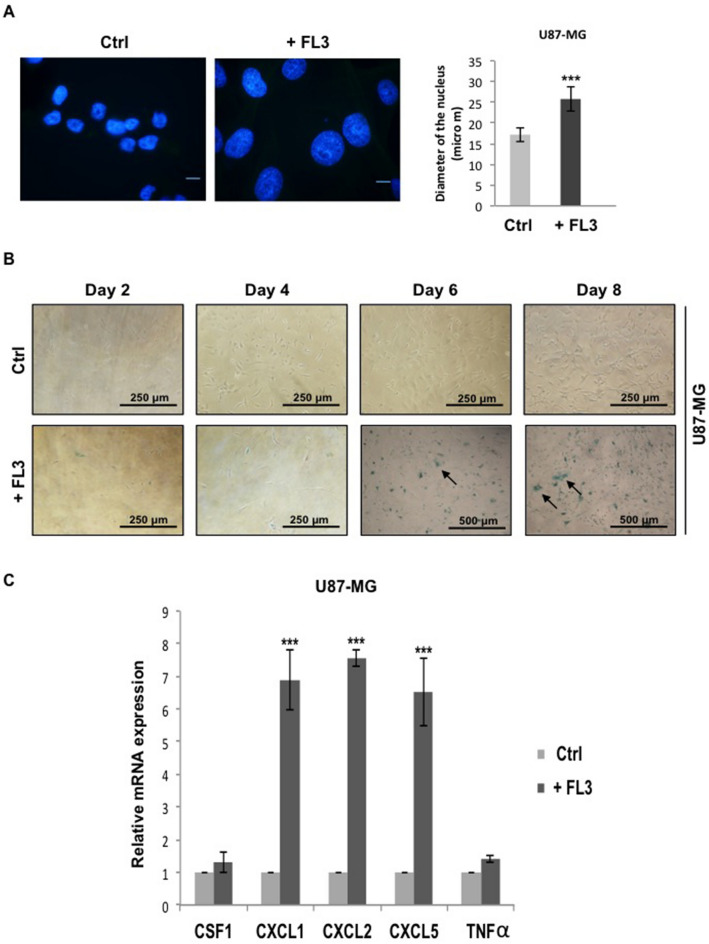
FL3 induced cellular senescence in U373 and LN443 glioblastoma cancer cells. (A) Observation and quantification of the nuclear shape and size in U87-MG control and treated cells with 200 nM FL3. 50 nuclei were measured for each condition. The scale bar represents 15 μm. Quantification of mean ± SEM from 3 independent experiments, ***P < 0.001 from control. (B) Representative senescence-associated β-galactosidase (SA β-gal) staining (blue) of control cells and U87-MG cells treated with 200 nM FL3, respectively. Pictures were taken at 2, 4, 6 and 8 days post-FL3 treatment. Black arrows indicate U87-MG positive cells. The scale bar represents: 250 and 500 µm. (C) Relative mRNA expression levels of SASP in control and treated U87-MG cells 6 days post treatment with 200 nM FL3. Quantification of mean ± SEM from 3 independent experiments, ***P < 0.001 from control.

