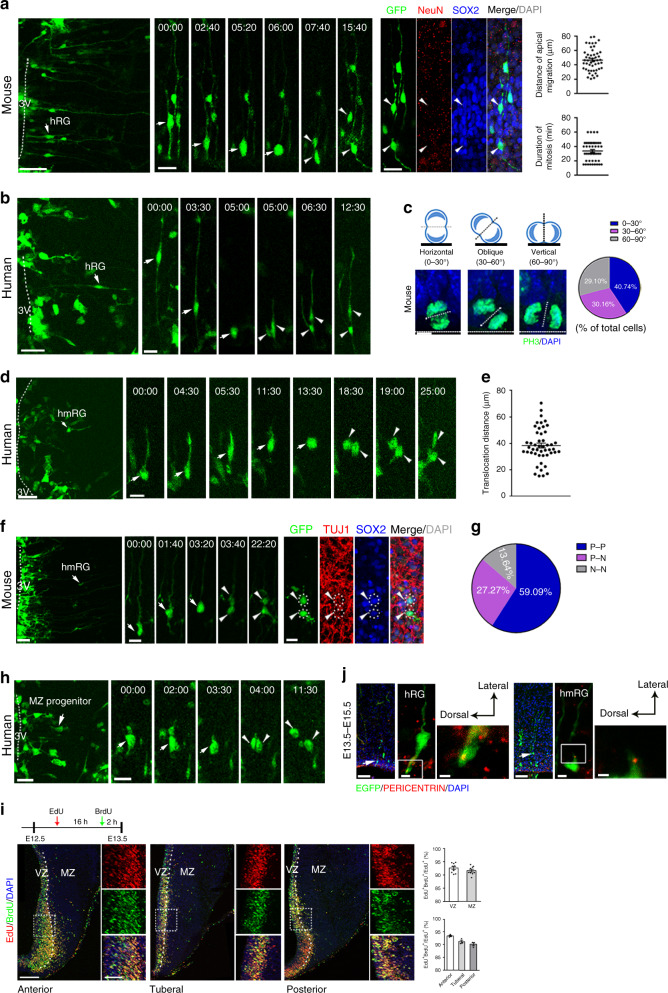
Fig. 2. Hypothalamic progenitors undergo classical division behavior.
a Adeno-GFP-labeled RGs (arrow) undergo INM and divide at the ventricular surface. An hmRG daughter cell (arrowhead) was SOX2+. Measurements of the distance of apical migration and mitotic duration (n = 49 cells). Scale bars, 50 μm (left) and 20 μm (middle and right). b Time-lapse imaging of human hypothalamic radial glia (n = 3 independent experiments). Dashed lines indicate the third ventricle. Time stamp, h:min. Scale bars, 50 μm (left) and 20 μm (right). c Measurement of the percentage of cells displaying a particular cleavage plane orientation at E13.5. d Time-lapse imaging of hmRGs labeled with Adeno-GFP in human hypothalamic slices. Time stamp, h:min. Scale bars, 50 μm (left) and 20 μm (right). e Quantification of hmRG mitotic somal translocation distances (n = 48 cells) in mice. f The GFP expressing hmRG (n = 6 independent experiments) produced both the daughter neurons that were TUJ1 positive. Time stamp, h:min. Scale bars, 50 μm (left), 20 μm (middle and right). g Analysis of post-time-lapse hmRG daughter cell fates in the mouse hypothalamus (n = 22 pairs). N: neuron, P: progenitor. h Time-lapse images of GFP-labeled MZ progenitor cells (arrows, n = 3 independent experiments) in the human hypothalamus. Arrowheads, daughter cells. Scale bars, 50 μm (left) and 20 μm (right). i Double labeling for EdU/BrdU in the developing mouse hypothalamus. Scale bars, 100 μm (left) and 50 μm (right). Right, high-magnification images of the outlined region, respectively, from anterior to posterior. Quantification of the percentage of EdU+BrdU+ cells among EdU+ cells in the VZ and MZ (n = 9 brain slices from 3 animals) and that in the MZ from anterior to posterior hypothalamus (n = 3 brain slices from 3 animals each groups). White dashed line, border of VZ and MZ. j Distinct centrosome positions in different progenitor cells (observed 20 hRG cells and 18 hmRG cells, respectively, from 3 independent experiments). Scale bars, 50 μm (left), 5 μm (middle), and 2 μm (right). Data are presented as mean values ± SEM in a, e, i. Source data are provided as a Source Data file.

