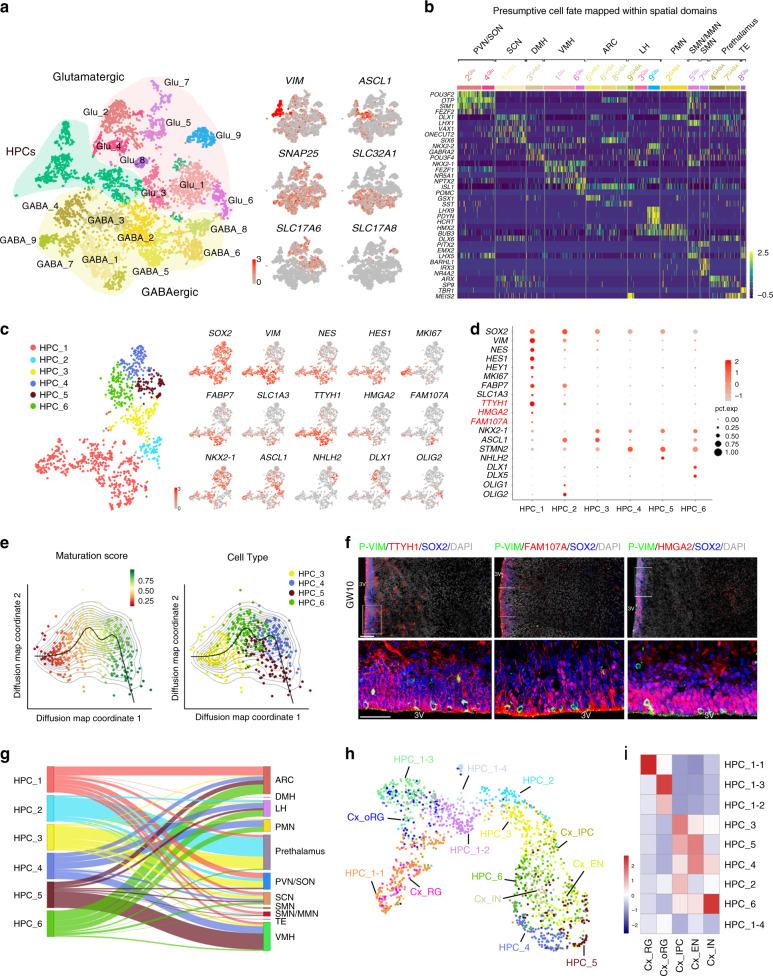
Fig. 4. Molecular diversity of cell types in the developing human hypothalamus.
a Visualization of major classes of cells using t-SNE. Different cell clusters are color coded. Right, expression of known markers in distinct cell clusters (gray, no expression; red, relative expression). HPC: hypothalamic progenitor cell, Glutamatergic: glutamatergic neuron clusters, GABAergic: GABAergic neuron clusters. b Heatmap showing a critical subset of region-specific genes in major hypothalamic and adjacent cell populations including the prethalamus and thalamic eminence (TE). Specific genes related to each spatial domain are highlighted on the left. The color key from purple to yellow indicates low to high gene expression, respectively. PVN/SON: paraventricular nucleus/supraoptic nucleus, SCN: suprachiasmatic nucleus, DMH: dorsomedial hypothalamus, VMH: ventromedial hypothalamus, ARC: arcuate nucleus, LH: lateral hypothalamus, PMN: premammillary nucleus, MMN: medial mammillary nucleus, SMN: supramammillary nucleus. c Visualization of six subtypes of hypothalamic progenitor cells using t-SNE (color on the left, subtypes of HPCs) with known marker expression (right: gray, no expression; red, increased relative expression). d Dot plot for specific markers of six subtypes of hypothalamic progenitor cells. Candidate markers are in red while known markers are in black. The color of each dot (gray, no expression; red, increased relative expression) shows average scale expression, and its size represents the percentage of cells in the subtypes. e A principal curve was fitted to the dominant diffusion map coordinates to order cells along a maturation trajectory. f Immunostaining for candidate markers including TTYH1, FAM107A, and HMGA2 with SOX2 and P-VIM, respectively (n = 3 independent experiments). Higher-magnification views of the boxed regions are shown at the bottom. Scale bars, 100 μm (top), 50 μm (bottom). g Alluvial plot showing the predicted relationship between hypothalamic progenitor clusters (left) and neuronal clusters with spatial location (right). h Integration of hypothalamic and cortical progenitor cells in human was visualized by UMAP, and clusters were colored differentially. Cx: cortex, EN: excitatory neuron, IN: inhibitory neurons, IPC: intermediate progenitor cell. i Gene expression correlation of progenitor subtypes between hypothalamus and cortex were visualized by heatmap. The scale bar indicates the Pearson correlation coefficient. Source data are supplied as a Source Data file.

