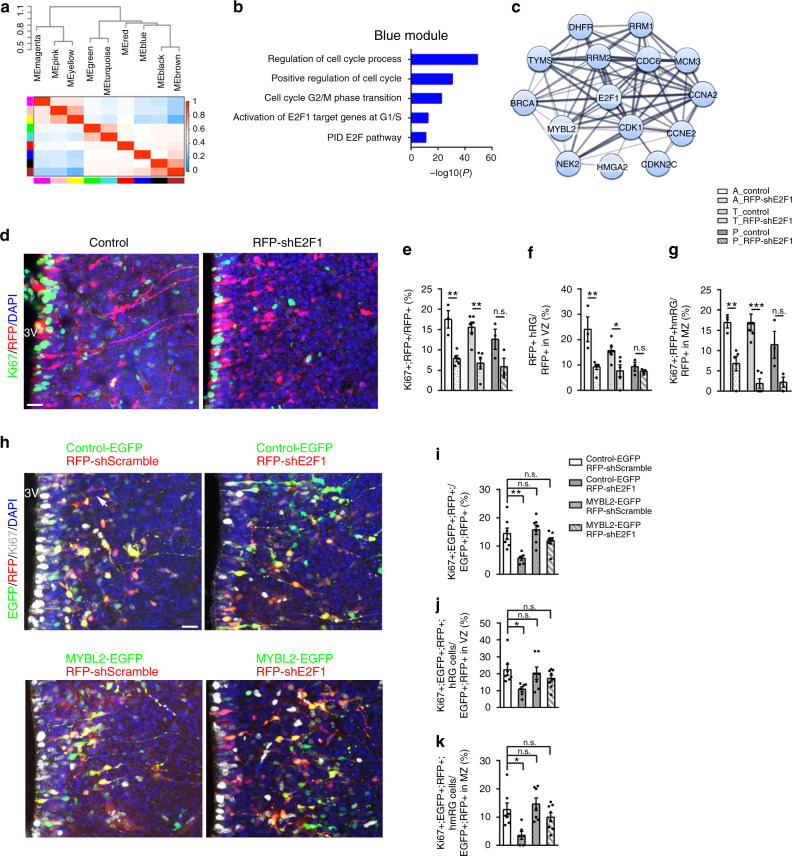
Fig. 5. Molecular signature of neural progenitor cells in the developing hypothalamus.
a Eigen gene heatmap showing the relationships among the modules across hypothalamic progenitor population. b Major gene ontology terms or pathways associated with the blue modules. c Functional network of genes/proteins involved in regulation of cell cycle. The network was generated with the STRING tool. d The knockdown of E2F1 decreased proliferating progenitor in mice hypothalamus (n = 3 independent experiments). Representative images of E14.5 hypothalamic sections electroporated with shControl (red) and shE2F1 (red) plasmids at E12.5 and immunostained with Ki67. Scale bar, 50 μm. e–g Quantification for the percentage of Ki67+ cells among RFP+ cells (e), Ki67+ hRG cells among RFP+ cells in hypothalamic VZ (f) and Ki67+ hmRG cells among RFP+ cells in hypothalamic MZ (g), respectively in the anterior–posterior axes. A: anterior, T: tuberal, P: posterior (n = 3 independent experiments); pA_control vs. A_RFP-shE2F1 = 0.002 (e), pT_control vs. T_RFP-shE2F1 = 0.003 (e), pP_control vs. P_RFP-shE2F1 = 0.1056 (e); pA_control vs. A_RFP-shE2F1 = 0.0084 (f), pT_control vs. T_RFP-shE2F1 = 0.0176 (f), pP_control vs. P_RFP-shE2F1 = 0.3729 (f); pA_control vs. A_RFP-shE2F1 = 0.008 (g), pT_control vs. T_RFP-shE2F1 = 0.0002 (g), pP_control vs. P_RFP-shE2F1 = 0.0579 (g); *p < 0.05, **p < 0.01, ***p < 0.001, two-tailed Student’s t test. h Overexpression of MYBL2 rescues the hypothalamic progenitor decrease by E2F1 knockdown in mice (n = 3 independent experiments). Co-expression of shE2F1-RFP and MYBL2-EGFP using electroporation at E12.5 mice. Samples of the E14.5 hypothalamus are immunostained by Ki67. Scale bar, 50 μm. i–k Quantification for the percentage of Ki67+ cells among electroporated EGFP+RFP+ cells. n = 7 brain slices from 3 animals in Control-EGFP+ shScramble, 6 brain slices from 3 animals in Control-EGFP+ shE2F1, 7 brain slices from 3 animals in MYBL2-EGFP+ shScramble, and 8 brain slices from 4 animals in MYBL2-EGFP+ shE2F1. One-way ANOVA and Tukey’s test to compare data sets. n.s.: not significant. *p < 0.05, **p < 0.01. Data are presented as mean values ± SEM. Source data are supplied as a Source Data file.

