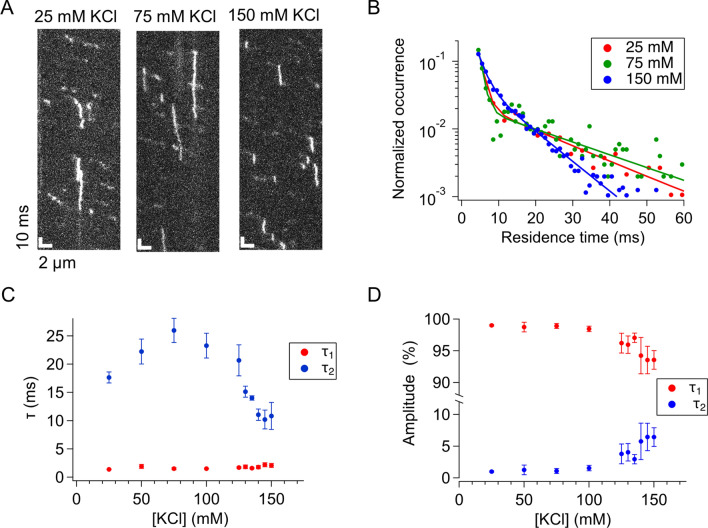
Figure 3.
Two components involved in the binding of p53 to DNA. (A) Typical kymographs of p53 obtained at the time resolution of 500 μs and at different salt concentrations. (B) Residence time distributions of p53 bound to DNA in the presence of different salt concentrations. Solid curves represent the best-fitted curves using the sum of two exponentials. (C) Salt-concentration dependence of the time constants obtained by the two exponential fitting. The τ2 values obtained in the presence of 140, 145, and 150 mM KCl were statistically different from that in 50 mM KCl based on the two-tailed t test (p < 0.05). (D) Salt-concentration dependence of the amplitudes obtained by the two exponential fitting. The errors in panels (C,D) denote the standard errors calculated from the results of at least three measurements.

