Figure 4.
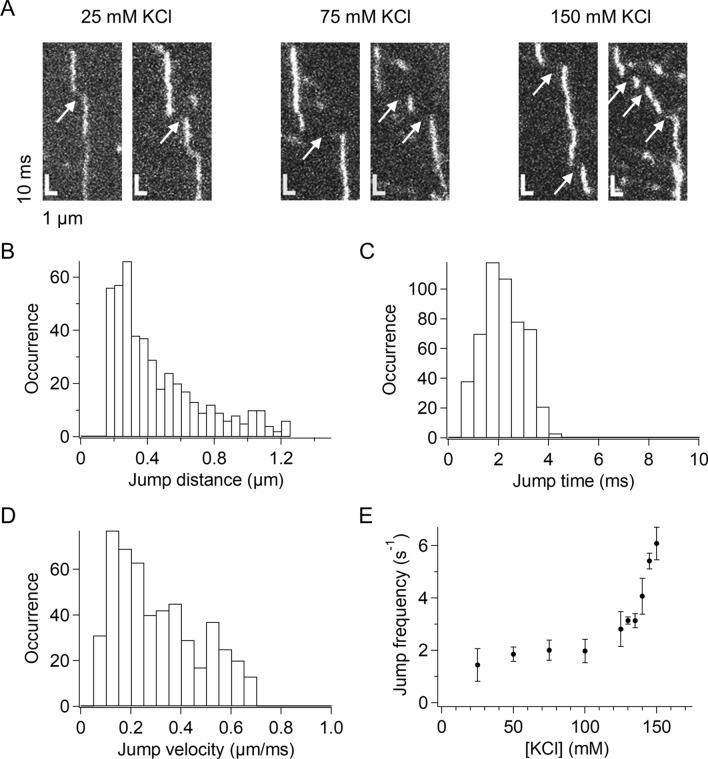
p53 jumped along DNA. (A) Typical kymographs of p53 demonstrating traces showing jumps along DNA obtained in the presence of different salt concentrations. Arrows denote the identified jumps. (B) Distribution of the jump distance of p53 observed in 150 mM KCl. (C) Distribution of the jump time of p53 observed in 150 mM KCl. (D) Distribution of the jump velocity of p53 observed in 150 mM KCl. (E) Salt-concentration dependence of the average jump frequency of p53. Errors denote the standard errors calculated from at least three measurements. The jump frequencies in 130, 135, 145, and 150 mM KCl were statistically different from that in 50 mM KCl (p < 0.05, two-tailed t test).

