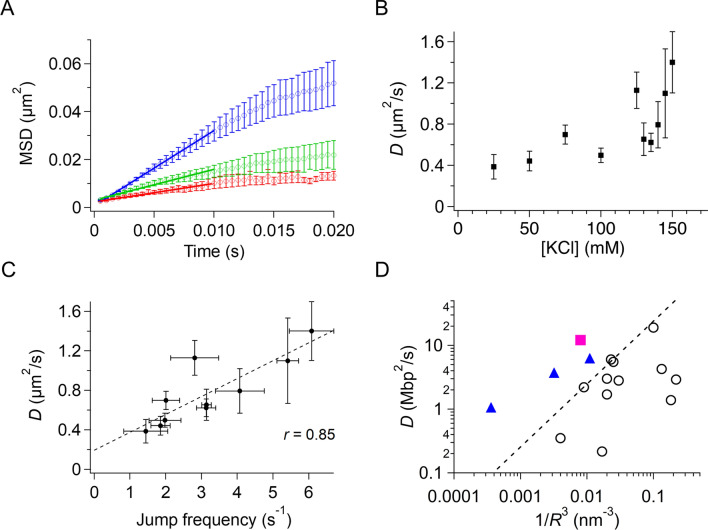
Figure 5.
Diffusion of p53 along DNA without following the DNA grooves in the presence of physiological salt concentrations. (A) Mean squared displacement (MSD) plots of p53 diffusing along DNA in the presence of different concentrations of salt. Red, green, and blue traces correspond to the plots obtained in the presence of 25, 100, and 150 mM KCl. Straight lines show the best fitted linear functions for the MSD data from 500 μs to 10 ms. (B) Salt-concentration dependence of the 1D diffusion coefficient of p53 along DNA. The data obtained in the presence of 125 and 150 mM KCl were statistically different from that obtained in 50 mM KCl (p < 0.05, one-tailed t test). (C) Relationship between the jump frequency and the 1D diffusion coefficient of p53 along DNA in the presence of different concentrations of salt. The dotted line is the best-fitted linear correlation of the two quantities. (D) Relationship between the reciprocal of the cube of the radius, 1/R3, and the 1D diffusion coefficient, D, along DNA for various DNA binding proteins. Open circles are data categorized for proteins demonstrating rotation-coupled diffusion along the grooves. The pink closed square denotes the datum for p53 obtained in 150 mM KCl using the current system. Triangles are the data for TALE showing rotation-uncoupled diffusion. The dashed line is the boundary between the rotation-coupled and uncoupled diffusions. In panels (A–C), the errors denote the standard error calculated from at least three measurements.

