Figure 5.

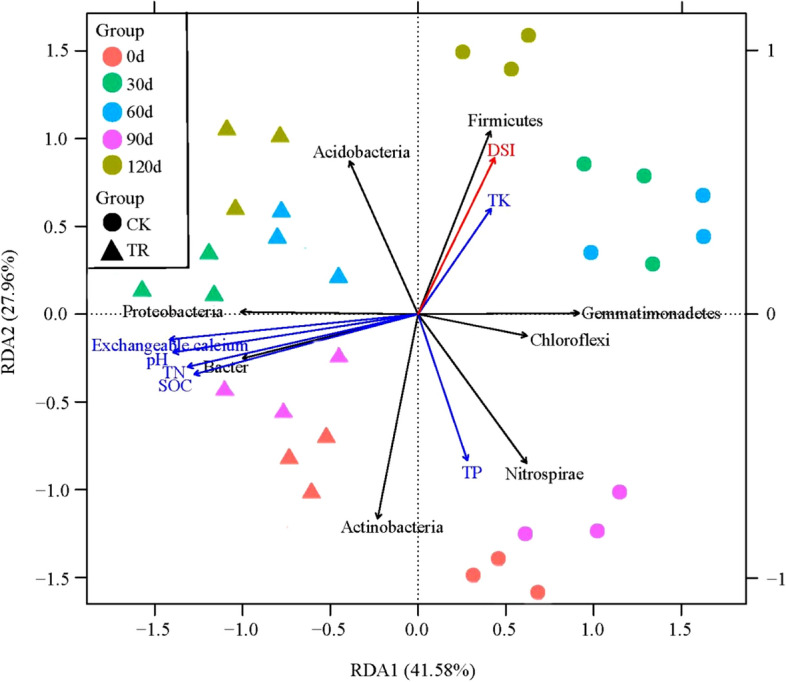
Redundancy Analysis (RDA) ordination plots show the relationships among bacterial phyla (black arrow), soil properties (blue arrow) and bacterial wilt disease severity (red arrow). Arrows indicated the direction and magnitude of variables.

Redundancy Analysis (RDA) ordination plots show the relationships among bacterial phyla (black arrow), soil properties (blue arrow) and bacterial wilt disease severity (red arrow). Arrows indicated the direction and magnitude of variables.