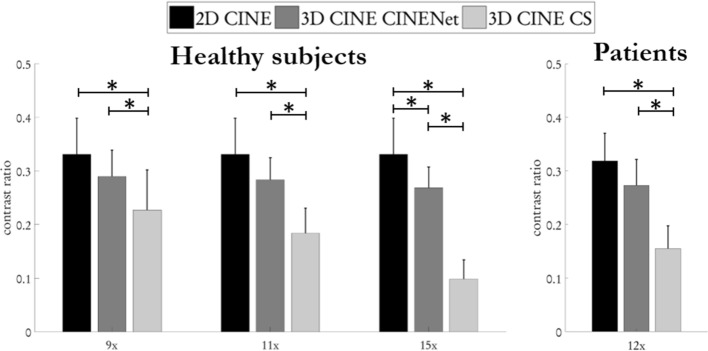
Figure 5.
Quantitative contrast ratio analysis between myocardium and left + right ventricular blood pool averaged over apical, mid-apical and basal slices of a cohort of 20 healthy subjects and 15 patients. Comparison between conventional multi breath-hold 2D CINE, single breath-hold 3D CINE acquired with prospective undersampling of 9× (scan time 12 s), 11× (scan time 10 s), 12× (scan time 10 s) and 15× (scan time 7 s) and reconstructed with Compressed Sensing (CS) for L1-regularized spatial wavelets and temporal total variation and the proposed 4D CINENet. Average and standard deviations are depicted. Statistical differences (p < 0.05) are indicated by *. No statistical difference occurs between 2D CINE and 3D CINENet, except at acceleration factor 15×. Figure was created using Python 3.6 and Matplotlib 3.2.245.

