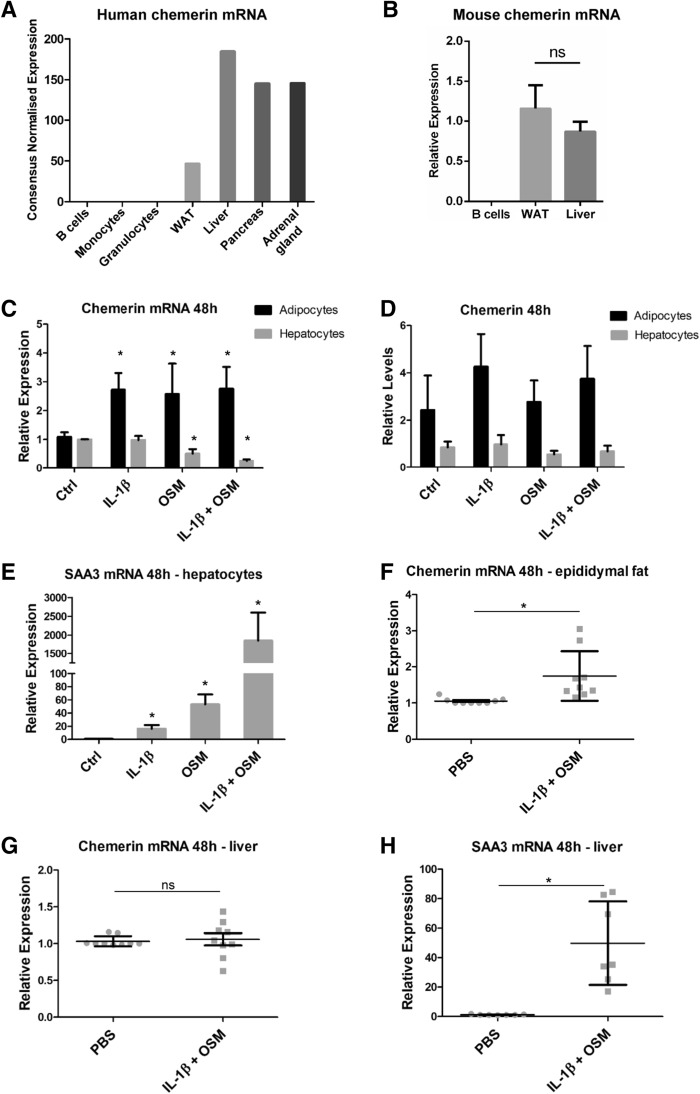
Figure 1.
Chemerin is constitutively expressed in the liver and WAT. Acute-phase cytokines upregulate chemerin expression in the adipocytes of WAT but not in hepatocytes. The Human Protein Atlas was used to compare human chemerin mRNA levels across multiple tissues and cells (A). B-cells, WAT, and liver tissue were chosen for further studies. Afterward, lymph nodes, liver tissue, and eWAT depots were excised from C57Bl6 mice and subjected to RT-QPCR analysis or isolation of B-cells, primary hepatocytes, or the SVF of eWAT. Relative chemerin mRNA levels across murine B-cells, liver tissue, and WAT are shown (B). SVF cells were differentiated to obtain a mature adipocyte cell culture. Then, the cells were treated with IL-1β (10 ng/mL), OSM (50 ng/mL), or a combination for 48 h. The levels of chemerin (C) and SAA3 (E) mRNA were determined using RT-QPCR. The relative expression of stimulated cells over the control is shown. Levels of secreted chemerin were determined in parallel in conditioned media by ELISA (D). Data are presented as the mean ± SD of at least three independent experiments. Statistical significance between the control and treated cells is shown by an asterisk; *p < 0.05 by ANOVA followed by a Bonferroni post-hoc test. In vivo, IL-1β and OSM were injected intraperitoneally at doses of 10 μg/kg BW and 160 μg/kg BW, respectively. After 48 h, liver tissue and eWAT were isolated and subjected to RT-QPCR analysis. The levels of chemerin mRNA in eWAT (F) or liver tissue (G) and SAA3 (H) were determined. Data are presented as the mean ± SD of at least three independent experiments. Statistical significance between the control (PBS) and the cytokine-treated animals is indicated by an asterisk; *p < 0.05 by the two-tailed Student’s t-test. All experiments were repeated at least three times.

