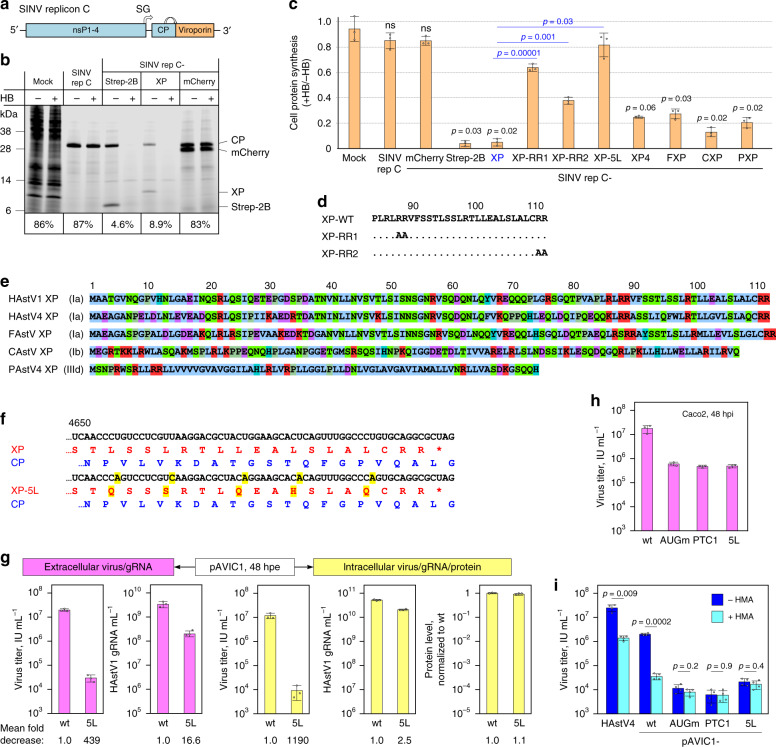
Fig. 6. XPs from different astroviruses have viroporin-like activity.
a Schematic representation of SINV replicon C used to evaluate cell-permeabilizing activity of expressed proteins. SINV elements: nsP1-4 – non-structural polyprotein; CP – capsid protein; SG – subgenomic promoter. b Membrane permeabilization in BSR cells at 8 h post RNA electroporation with Sindbis virus replicons (SINV repC) expressing HAstV1 XP, enterovirus Strep-2B (positive control), or mCherry (negative control). Ongoing protein synthesis was labeled with 1 mM AHA in the presence or absence of 1 mM HB as a translation inhibitor. Cells were lysed and AHA-bearing proteins were ligated to the fluorescent reporter IRDye800CW Alkyne by click chemistry, separated by SDS-PAGE, and visualized by in-gel fluorescence. Numbers below each pair of samples indicate protein synthesis quantified for HB-treated cells relative to values obtained for untreated cells. c Statistical analysis of membrane permeabilization caused by different XPs and mutants and the indicated control proteins in BSR cells. Bars indicate the amount of protein synthesis in HB-treated cells relative to untreated cells. P values are from comparisons with mock (BSR; black) or with pSINV-repC-XP (blue). d Sequences of wt, RR1, and RR2 HAstV1 mutants. e Sequences of HAstV1, HAstV4, and feline (FAstV), canine (CAstV) and porcine (PAstV) astrovirus XPs. f Alignment of pAVIC1-wt and -5L showing translation of XP (red) and the overlapping CP (blue). Introduced nucleotide and amino acid changes are highlighted in yellow. g Quantification of virus titer, RNA, and protein levels in released virions and infected cells as described in Fig. 4g. h Caco2 cells were infected with the indicated viruses at MOI 0.2 and incubated for 48 h. Released virus in clarified supernatants was titrated. i Caco2 cells were infected with the indicated viruses at MOI 0.2 in the presence (dark blue) or absence (light blue) of 5 µM hexamethylene amiloride (HMA). Intracellular (HMA-free) virus was titrated. See Supplementary Fig. 20 for cell toxicity data. P values come from two-tailed t-tests without adjustment for multiple comparisons. Error bars indicate mean ± s.d.; n = 3 (c, g, h) or 4 (i) biologically independent experiments. Source data are provided as a Source Data file.

