
Fig. 4. TIP associations with secondary metabolism.
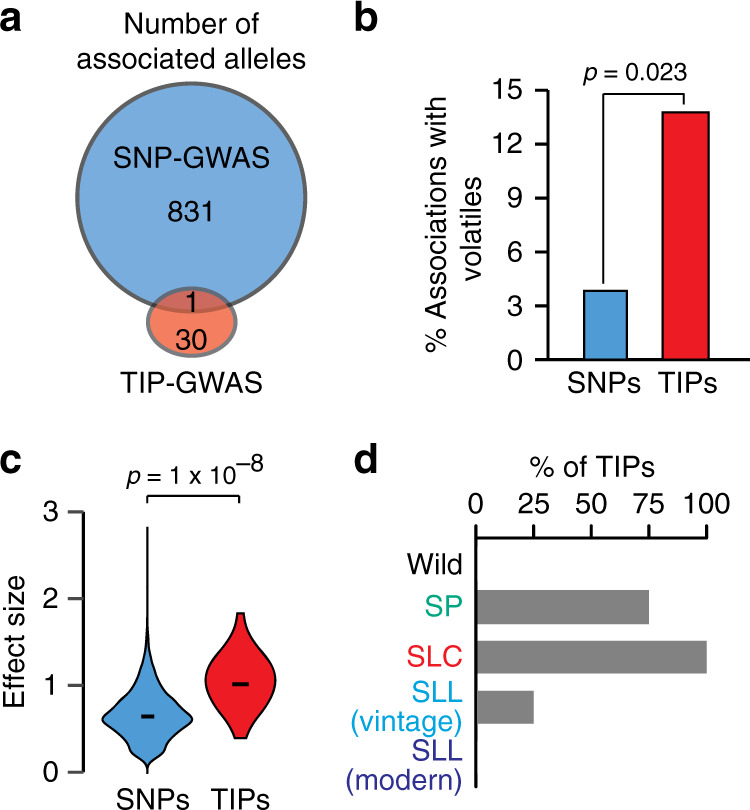
a Significant associations detected by SNP- and TIP-GWAS and their overlap. b Percentage of identified loci associated with variation in volatiles. Statistical significance for differences was obtained using a two-sided Fisher test. c Effect size for association signals detected in SNP- and TIP-GWAS. Statistical significance for differences was obtained using a two-sided MWU test. d Percentage of TIPs with significant associations present within each of the five tomato groups. Source data of Fig. 4a, b, d are provided as a Source Data file.