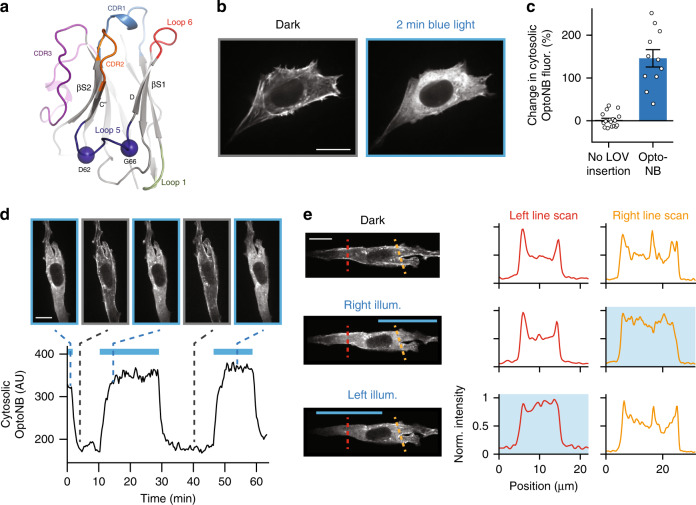
Fig. 5. Development and characterization of an anti-actin OptoNB.
a Position DG62-66 targeted for the LOV domain insertion into the α-actin nanobody and mapped onto the crystal structure of the anti-GFP minimizer nanobody (PDB ID: 3G9A). Residues D62 and G66 (blue spheres) are highlighted within Loop 5 (dark blue). CDRs, Loop 1, and Loop 6 are colored as previously described in Fig. 1. b Still frames showing dark and illuminated conditions for a cell expressing the actin OptoNB fused to TagRFP. c Light-induced translocation of actin OptoNBs. The light-induced change in cytosolic intensity from the original, dark-equilibrated value is shown. Error bars indicate means ± SEM for n = 17 and 11 cells, respectively. d Reversible actin OptoNB translocation to and from the cytoskeleton in a representative cell. Curve indicates the mean intensity in a cytosolic region in response to pulses of blue light (blue bars). Upper images show the cell at the indicated time points. e Spatial illumination leads to local nanobody unbinding. Left panels: representative images of a representative cell that was left un-illuminated or illuminated for 10 min on its left or right half. Dashed lines indicate positions of line scans for quantifying local enrichment along actin filaments. Right panels: quantification of actin OptoNB fluorescence along the line scans in dark, left, or right illumination. Scale bars: 20 μm. Source data are available as a Source data file.

