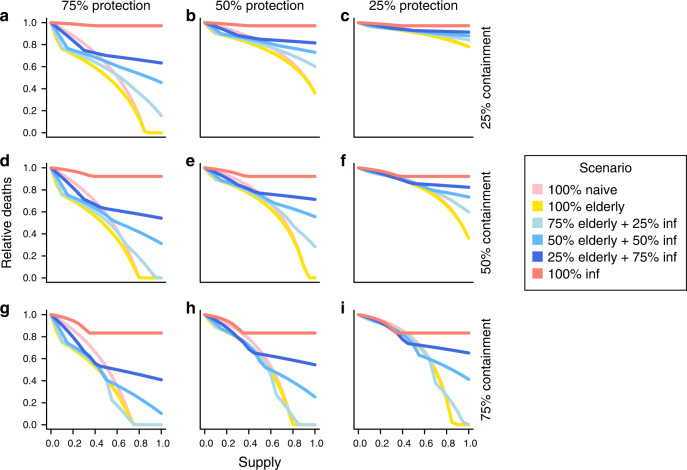
Fig. 2. Reduction in total deaths under each distribution strategy for a range of mask availability levels.
Each panel represents mask effectiveness in terms of relative protection and containment. Containment levels of 25% a–c, 50% d–f, and 75% g–i are shown with varying protection levels; c represents the least effective mask and g represents the most effective mask. Masks are provided naively (pink), prioritized to the elderly (yellow), saved for detected cases (red), or balanced at different levels between healthy individuals, prioritizing the elderly, and detected cases (blue). Inflection points occur at the point where supplies are exhausted, and the outbreak continues with no new individuals adopting masks. Here, 30% of infections are assumed to be undetected. See “Methods” for further details.

