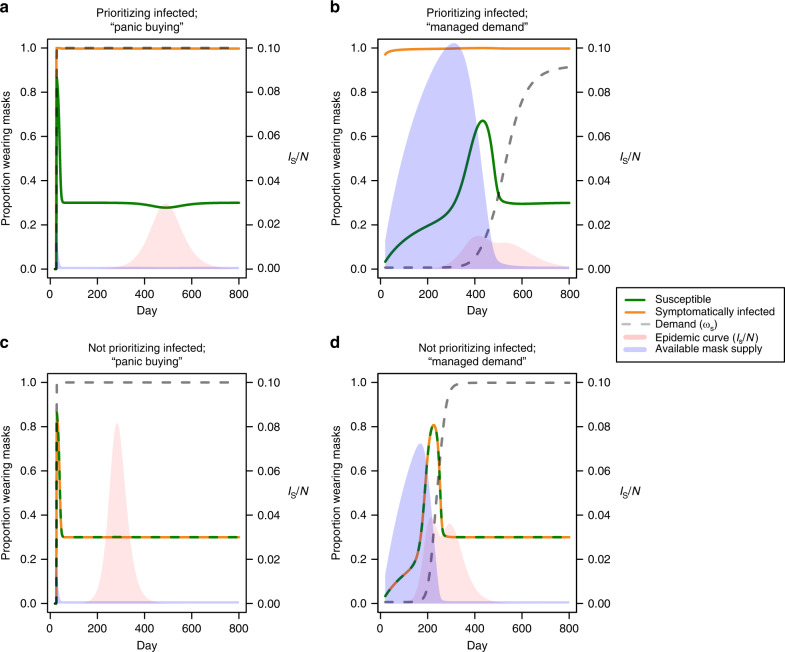
Fig. 4. Early demand management can limit the total number of infections.
While prioritizing masks for infectious cases, epidemic curves (pink) and mask supply (blue) are shown in a a “panic buying” demand curve and b a more gradual “managed demand” curve. Demand is shown as a dashed gray line, while the proportion of the susceptible and symptomatically infected population wearing masks are shown as green and orange lines, respectively. (k1, k2) are (1, 100) and (10−6, 5 × 10⁶) for “panic buying” and managed demand, respectively (see “Methods”). The dynamics shown here are based on mask production rate, B/N, equal to 30%. Equivalent plots are provided showing dynamics when infectious cases are not prioritized under c “panic buying” and d “managed demand” scenarios.

