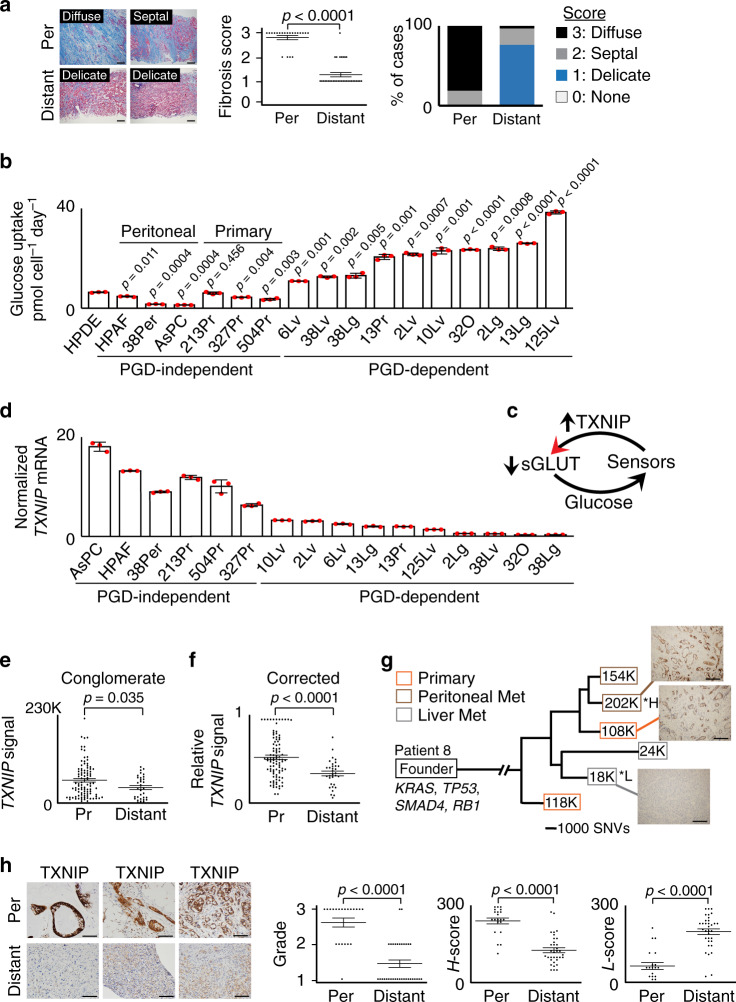
Fig. 1. TXNIP is recurrently suppressed in PDAC distant metastases.
a (Left) Representative Masson’s trichrome stains for collagen (blue) shows metastatic peritoneal deposits (top, n = 21 individual patient samples) embedded within diffuse geographic (scored 3) or thick septal (scored 2) fibrosis. Delicate thin strands of fibrosis (scored 1) are instead present in distant metastases (bottom, n = 34 individual patient samples). Scale bars: 200 µm. (Right) Graphical summaries of fibrosis scores (error bars: s.e.m., p < 0.0001 by two-tailed t tests and two-sided Mann–Whitney U tests). b Glucose consumption rates were elevated for the indicated PGD-dependent cells, relative to the indicated PGD-independent control cells (n = 3 technical replicates, error bars: s.d.m., indicated p values calculated by two-tailed t tests). c Illustration depicting how glucose-sensing negative feedback loops utilize TXNIP to prevent excessive glucose uptake. dTXNIP mRNA expression was downregulated in PGD-dependent subclones relative to PGD-independent controls (n = 3 technical replicates, error bars: s.d.m.). eTXNIP transcript levels were lower overall in liver metastases (distant, average: 40,790, n = 32 separate metastases) than from multiregional areas in primary tumors (Pr, average: 59,653, n = 95 separate primary regions). Data represent total TXNIP read counts from RNA-seq datasets (n = 10 total patients, error bars: s.e.m., p = 0.035 by two-sided Mann–Whitney U tests). f Similar results were obtained when TXNIP read counts were corrected for differences in baseline expression (n = 95 primary tumor regions [Pr] and 32 liver metastases [Distant] from 10 total patients, error bars: s.e.m., p < 0.0001 two-sided Mann–Whitney U tests). g Phylogenetic tree of patient 8 showing TXNIP expression for the indicated primary tumor subclones (orange boxes), metastatic peritoneal deposits (brown boxes), and liver metastases (gray boxes). Boxed values indicate TXNIP transcript expression from RNA-seq data (K units: thousands of read counts divided by the estimated tumor purity fractions, *H: highest, *L: lowest, SNV scale: single-nucleotide variants). IHC stains (connected by lines) confirmed loss of TXNIP protein in the indicated liver metastasis (scale bars: 200 µm). Similar results were obtained for two other patients with available phylogenetic data (Supplementary Fig. 1e, f). h (Left) Representative IHC stains for TXNIP (brown) show diffusely strong reactivity in peritoneal metastatic cells (n = 21 individual patient samples). Distant metastases show low or heterogeneous staining (n = 34 individual patient samples). Scale bars: 200 µm. Plots: IHC scored by a three-tiered grading scheme (left), H-scores weighted for high expression (middle), and H-scores weighted for low expression (right), as described in the “Methods” (error bars: s.e.m., p < 0.0001 by two-sided Mann–Whitney U tests).

