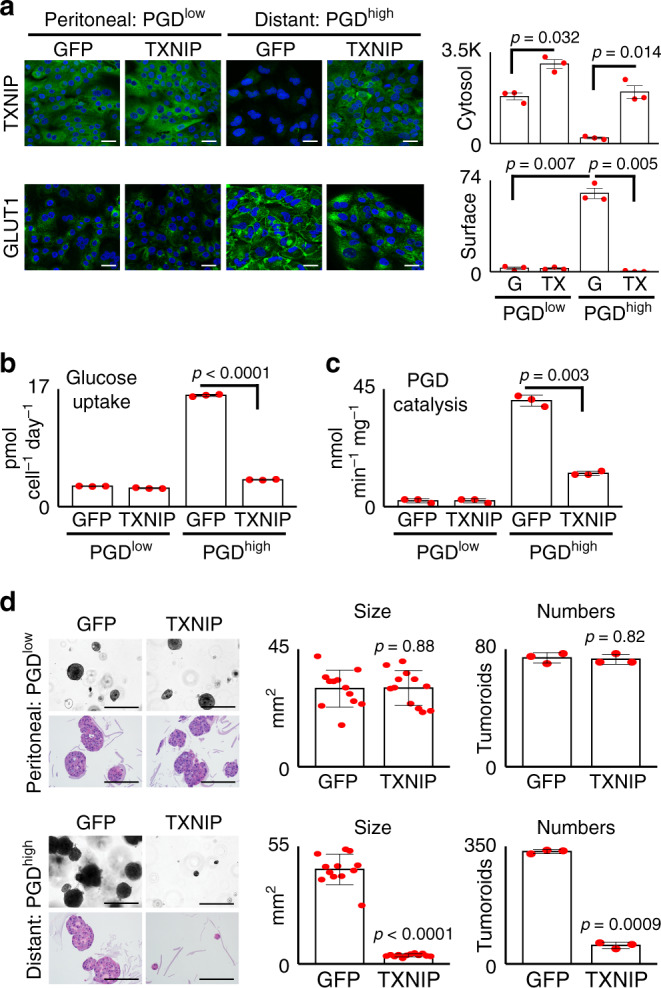
Fig. 3. Exogenous TXNIP phenocopies PGD inactivation.

a Expression of exogenous TXNIP (top panels) in the PGDhigh distant metastasis (38Lg) to levels comparable with baseline TXNIP expression in control PGDlow peritoneal deposit (38Per) removed GLUT1 from the cell surface in PGDhigh cells (bottom panels) (n = 3 biological replicates; error bars: s.e.m., indicated p values calculated by two-tailed t tests; G: GFP; TX: TXNIP). Scale bars: 20 µm. b Exogenous TXNIP slowed glucose consumption in the PGDhigh cells down to rates comparable with matched PGDlow controls (n = 3 technical replicates, error bars: s.d.m., p < 0.0001 by two-tailed t tests). c Exogenous TXNIP also slowed PGD catalytic rates in PGDhigh cells (y-axis: NADPH production rates; n = 3 technical replicates, error bars: s.d.m., p = 0.003 by two-tailed t tests). d Exogenous TXNIP strongly impaired 3D tumoroid growth of PGDhigh cells with no effect on control PGDlow controls (n = 3–12 technical replicates; error bars: s.d.m., indicated p values calculated by two-tailed t tests). Top panels: brightfield microscopy of live tumoroids. Bottom panels: H&E stains of fixed tumoroids. Scale bars: 400 µm.
