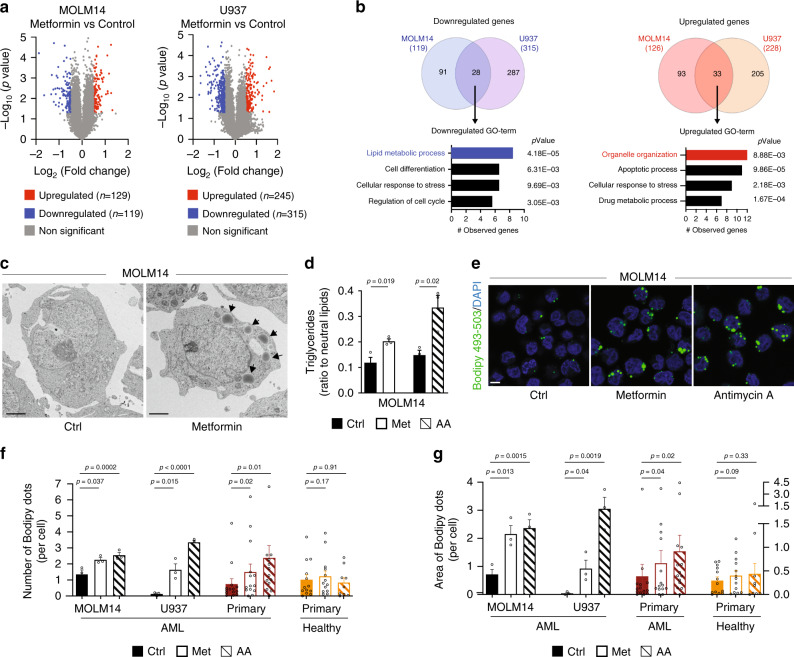
Fig. 2. Inhibition of OxPHOS affects lipid metabolism.
a Volcano plots displaying fold change versus adjusted p-values of MOLM14 (left) and U937 (right) cells treated with 10 mM of metformin (Met) for 24 h (p-value < 0.05, absolute log2 fold change > 0.5, unpaired t-test). b Venn diagram representing overlap between MOLM14 and U937 downregulated (left) and upregulated (right) genes. Enrichment analysis of Gene Ontology (GO) classification for common downregulated (left) and upregulated (right) genes by Genomatics software analysis (Fisher’s exact test). c MOLM14 cells treated with Met (10 mM) for 24 h were fixed and processed for transmission electron microscopy analysis. Representative electron microscopy pictures from two independent experiments are shown. Arrows indicate lipid droplets. Scale bar: 2 µm. d MOLM14 cells were treated with Met or with antimycin A (AA) and processed for triglycerides content analysis, (n = 3, unpaired t-test). e MOLM14 cells were treated with Met or with AA, fixed and stained for Bodipy 493/503 and DAPI. Representative confocal pictures from three independent experiments are shown. Scale bar: 10 µm. f, g MOLM14 (n = 3) and U937 (n = 3) AML cell lines, primary AML patient cells (n = 14) and primary normal hematopoietic cells (PBMC n = 9; CD34+n = 4) were treated with Met or with AA for 48 h, fixed, and stained for Bodipy 493/503 and DAPI. Histograms show the number (f) or the area (g) of Bodipy 493/503 dots per cell (unpaired t-test or paired t-test for patients’ samples). Data are means ± s.e.m.

