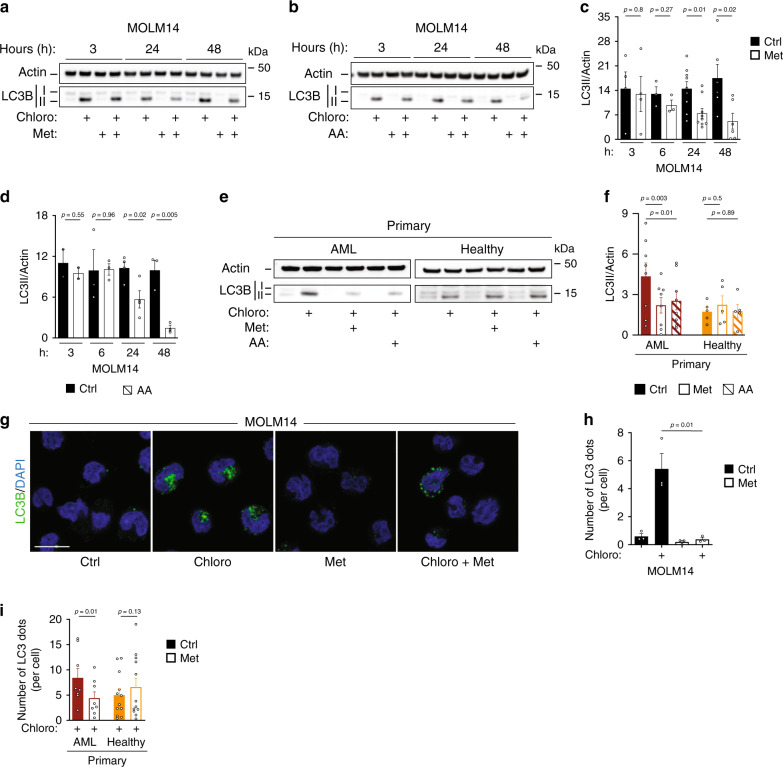
Fig. 3. Inhibition of OxPHOS reduces autophagic flux.
a, b Western blots of LC3B and actin from at least three independent experiments of MOLM14 cells treated with metformin (Met) (a) or with antimycin A (AA) (b) ± chloroquine (chloro) for the indicated times are shown. c, d LC3B-II/actin ratios identified by densitometries from Western blots shown in a, b in MOLM14 cells treated with Met (c) or with AA (d) in presence of chloro. Data are means ± s.e.m, (at least n = 3, unpaired t-test). e Western blots of LC3B and actin from primary AML (n = 8) or normal (n = 5) cells treated with Met or with AA ± chloro. f Primary AML patient cells (n = 8 with Met, n = 8 with AA) and primary normal hematopoietic cells (PBMC) were treated with Met (n = 5) or AA (n = 5) for 48 h in presence of chloro followed by immunoblotting for LC3B and actin. Histograms represent the LC3B/actin ratios obtained by densitometric analysis of Western blots (paired t-test). g, h Representative confocal pictures from three independent experiments of MOLM14 cells treated with Met for 48 h ± chloro, fixed and stained for LC3B and DAPI. Scale bar: 10 µm. g Histograms represent the number of LC3B puncta per cell (h), (n = 3, unpaired t-test). i Primary AML patient cells (n = 8) and primary normal hematopoietic cells (PBMC n = 8, CD34+n = 4) were treated or not with Met for 48 h ± chloro, fixed and stained for LC3B and DAPI. Histograms represent the number of LC3B puncta per cell (paired t-test). Data are means ± s.e.m.

