
Figure 4. Photoreceptor Degeneration at the Boundary of Geographic Atrophy (GA).
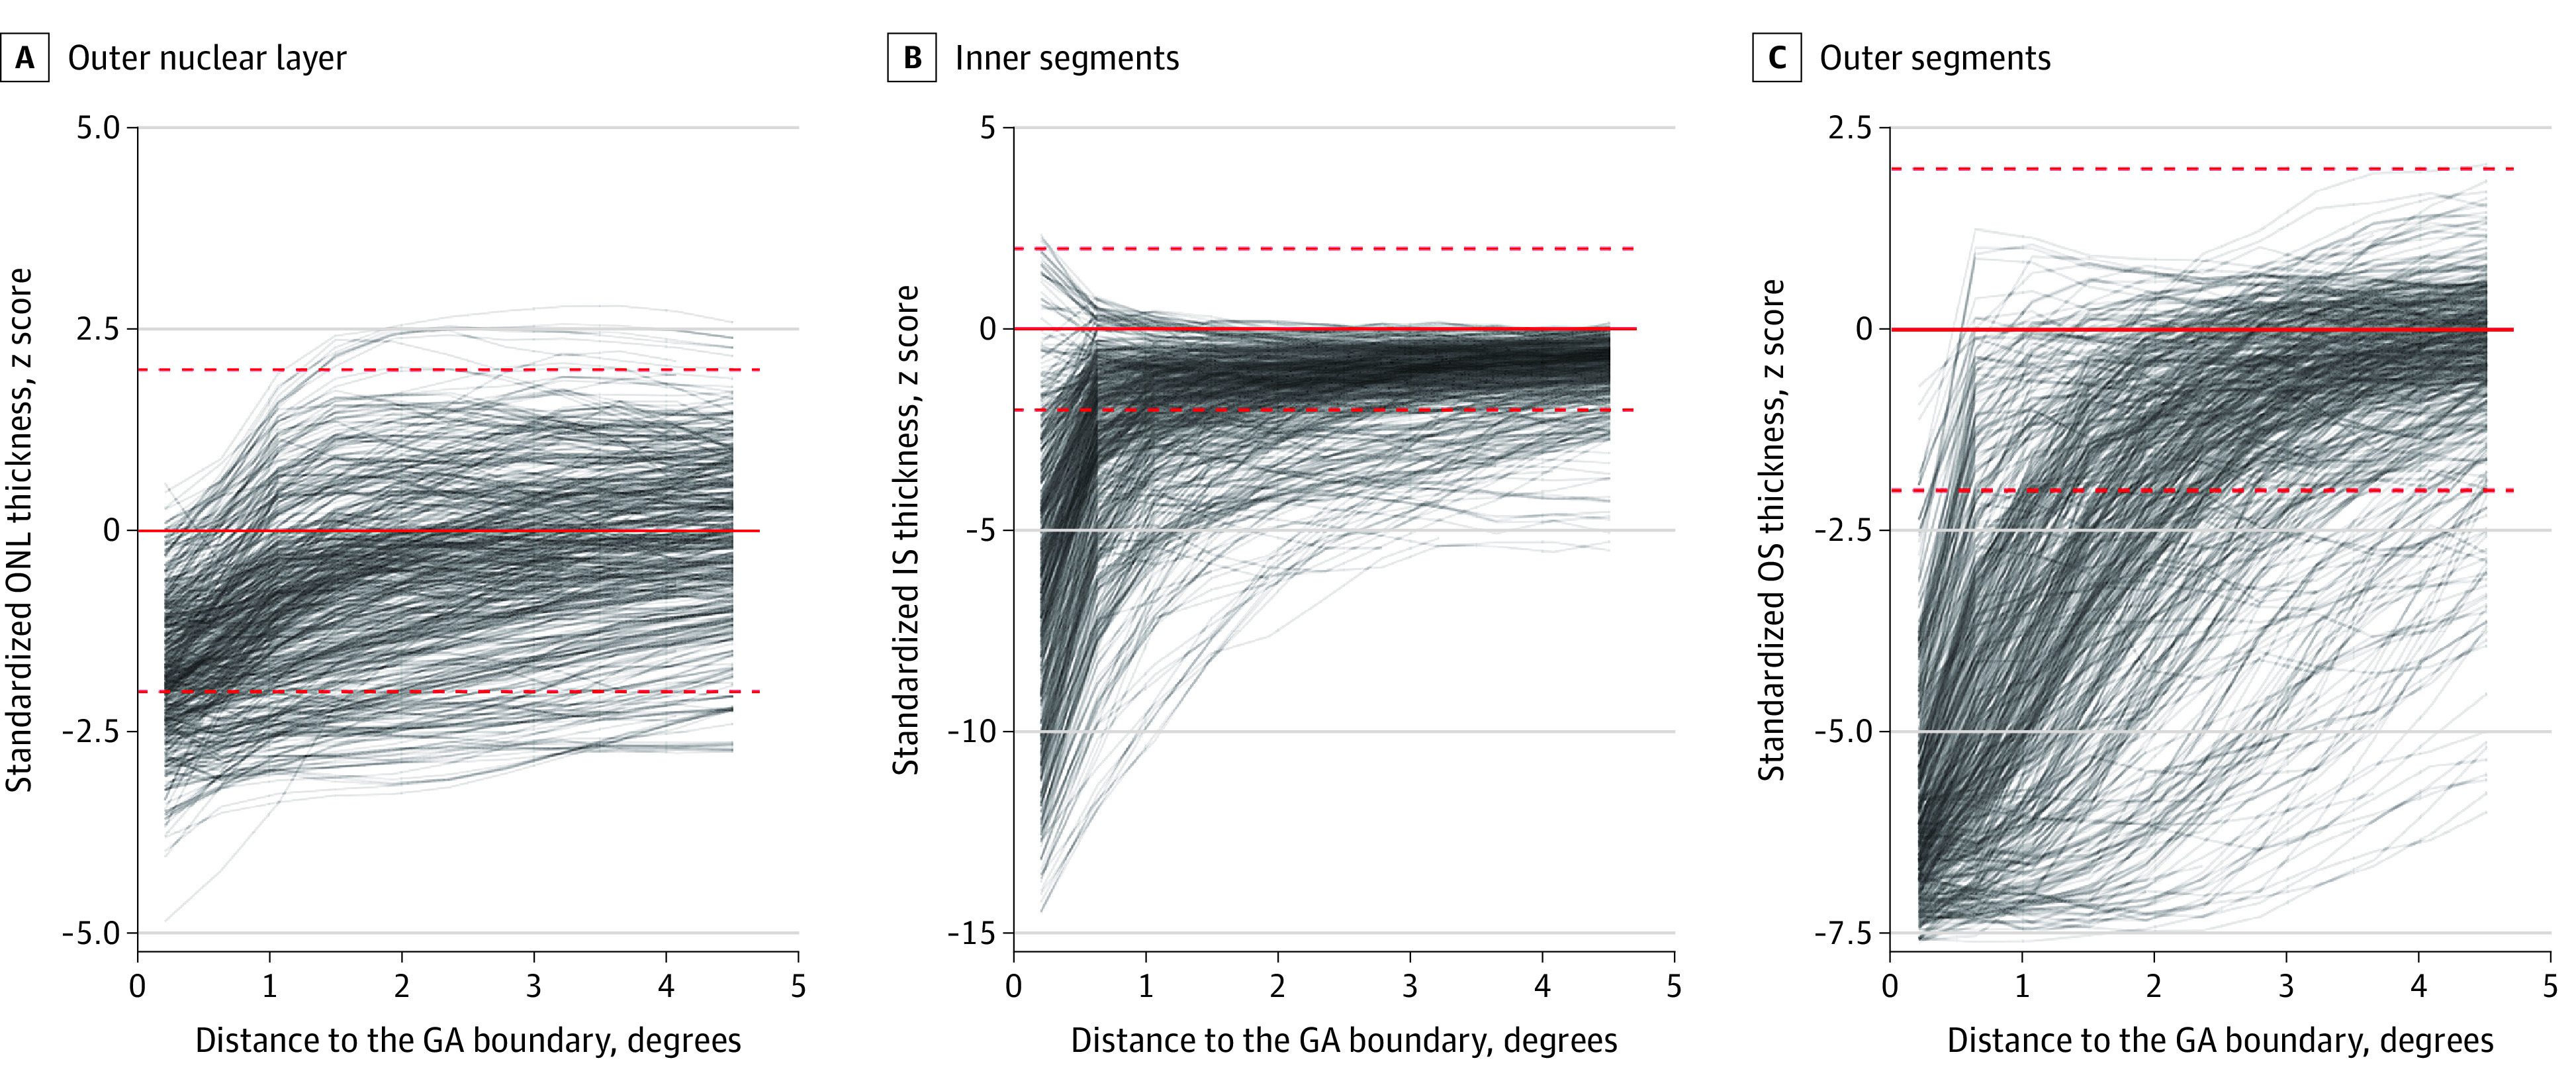
The 3 panels show the outer nuclear layer (ONL; A), photoreceptor inner segments (IS; B), and outer segments (OS; C) thicknesses in dependence of the distance to the GA boundary. The y-axis denotes the z scores (accounting for retinal location and age). Each visit of each eye is plotted by a semitransparent line. The red dashed lines indicate the z score range of −2 to 2 normative SDs. eFigure 6 in the Supplement shows these data in terms of the absolute thickness deviations.