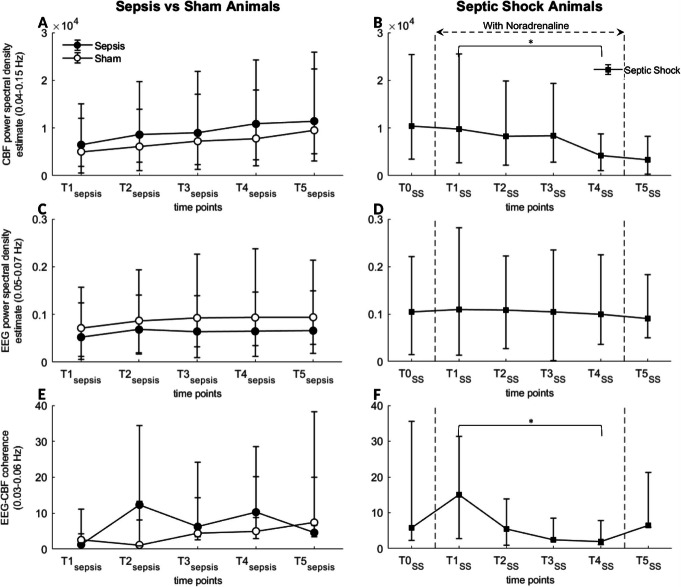
Fig. 3.
Temporal evolution of neurovascular coupling measured by coherence between periodic fluctuations of cortical activity and cerebral blood flow. Cerebral blood flow velocity (CBFv) spectral power (0.04–0.15 Hz frequency band; a, b), second-level spectral power of gamma activity envelope (Eγ; 0.05–0.07 Hz frequency band; c, d), and their magnitude-squared coherence (MSC; 0.03–0.06 Hz frequency band; e, f) in sepsis vs. sham groups (a, c, e) and in septic shock group (b, d, f), expressed as median and inter-quartile range. *p < 0.05 by RMANOVA test analysis. No significant difference, neither in CBFv nor in Eγ spectra fluctuations nor in MSC, was observed in sepsis and sham animals in any of the frequency bands considered. In the septic shock group, there was a significant decrease between T1SS and T4SS in the spectrum of CBFv fluctuations between 0.04 and 0.15 Hz and a significant decrease in MSC for frequencies between 0.03 and 0.06 Hz. Comparative analysis for other frequencies of CBFv and Eγ spectral power and MSC are presented in Supplemental Figure S3 (a, b, c). Power spectral density estimation are expressed in √dB/Hz

